Instances
Managing generator instances in Studio — the instance table, lifecycle controls, metrics dialog, and log viewer.
The Instances page is where you manage generator instances — the running (or finished) copies of your generator projects. Each instance represents a single execution of a generator with its own metrics, logs, and lifecycle.
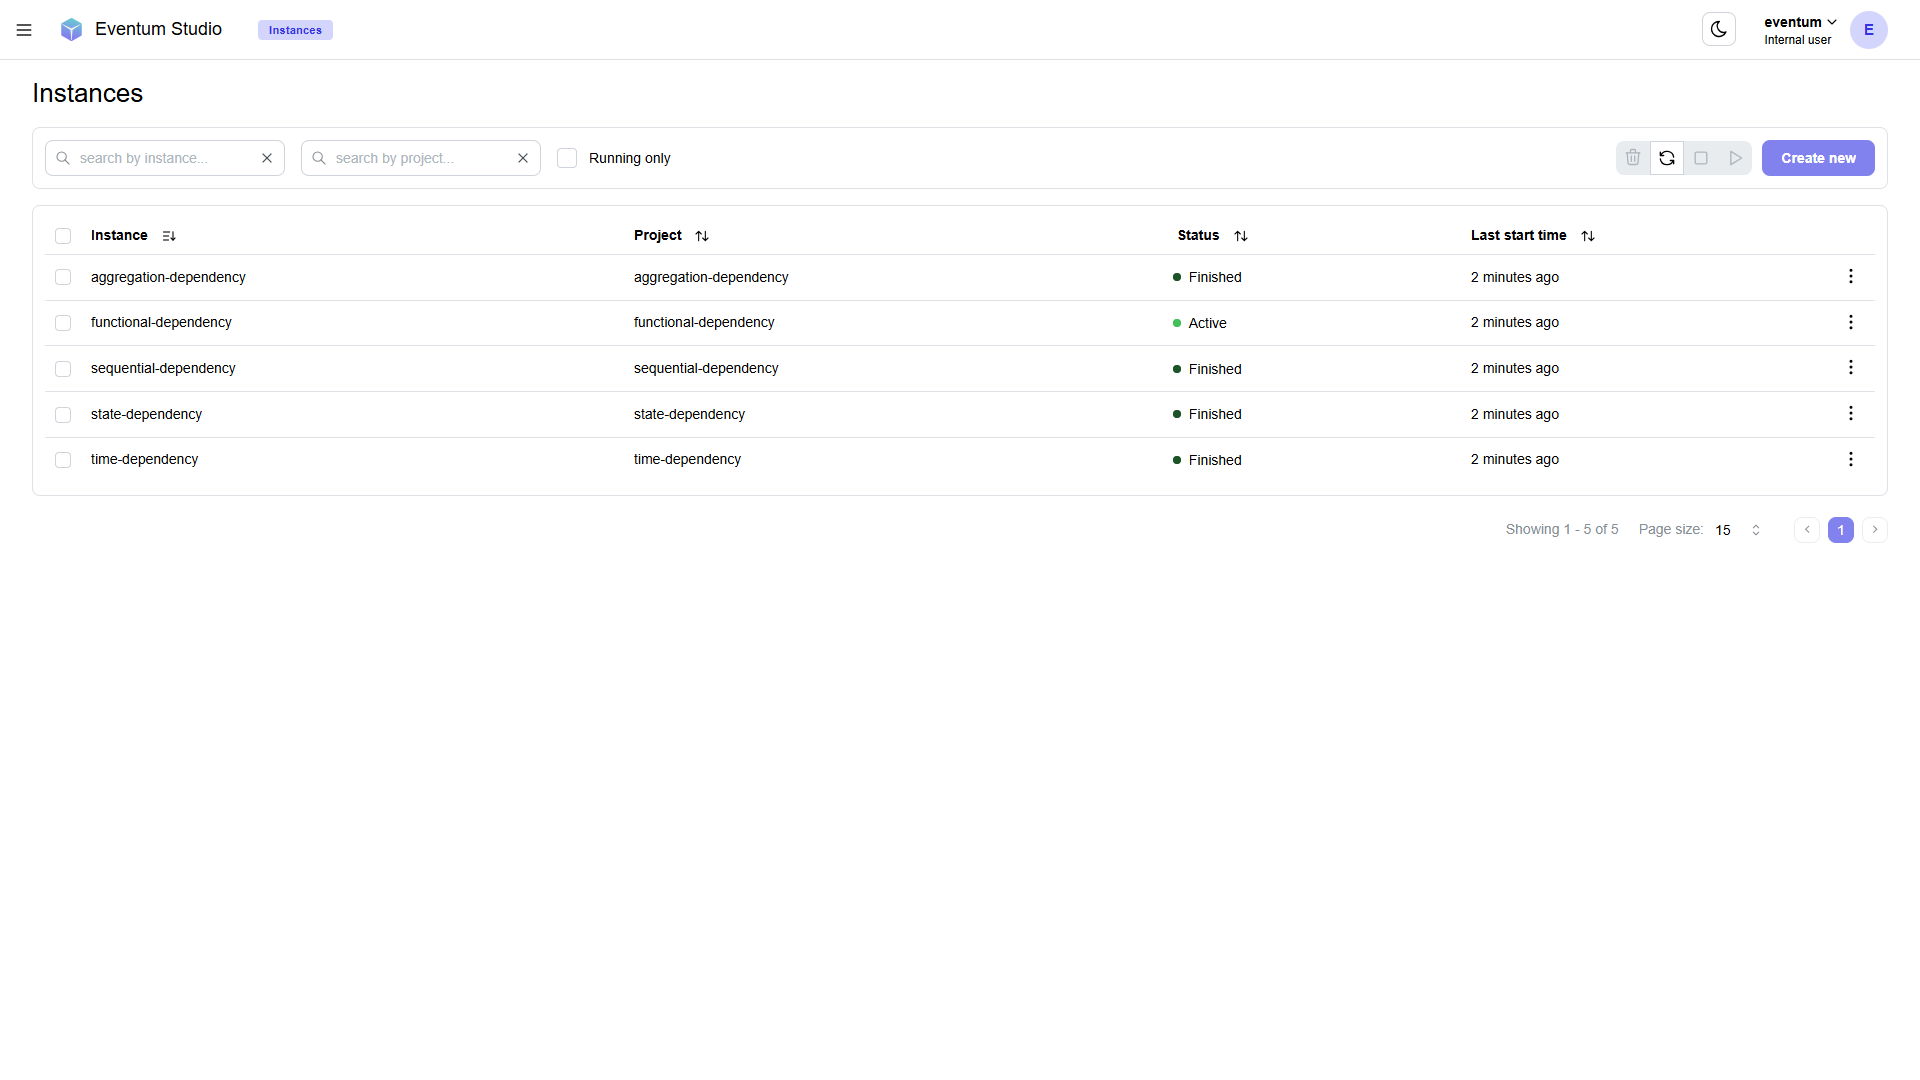
Instance table
The main area is a sortable, paginated table with the following columns:
| Column | Description |
|---|---|
| Instance | The unique ID of the instance (assigned in startup.yml or when creating a new instance). |
| Project | The generator project this instance is running. Links to the project editor. |
| Status | Current state — Active (green dot) for running instances, Finished (green dot) for instances that completed normally, Failed for instances that stopped due to an error. |
| Last start time | When the instance was most recently started (relative time, e.g. "2 minutes ago"). |
Columns are sortable — click any column header to sort ascending or descending.
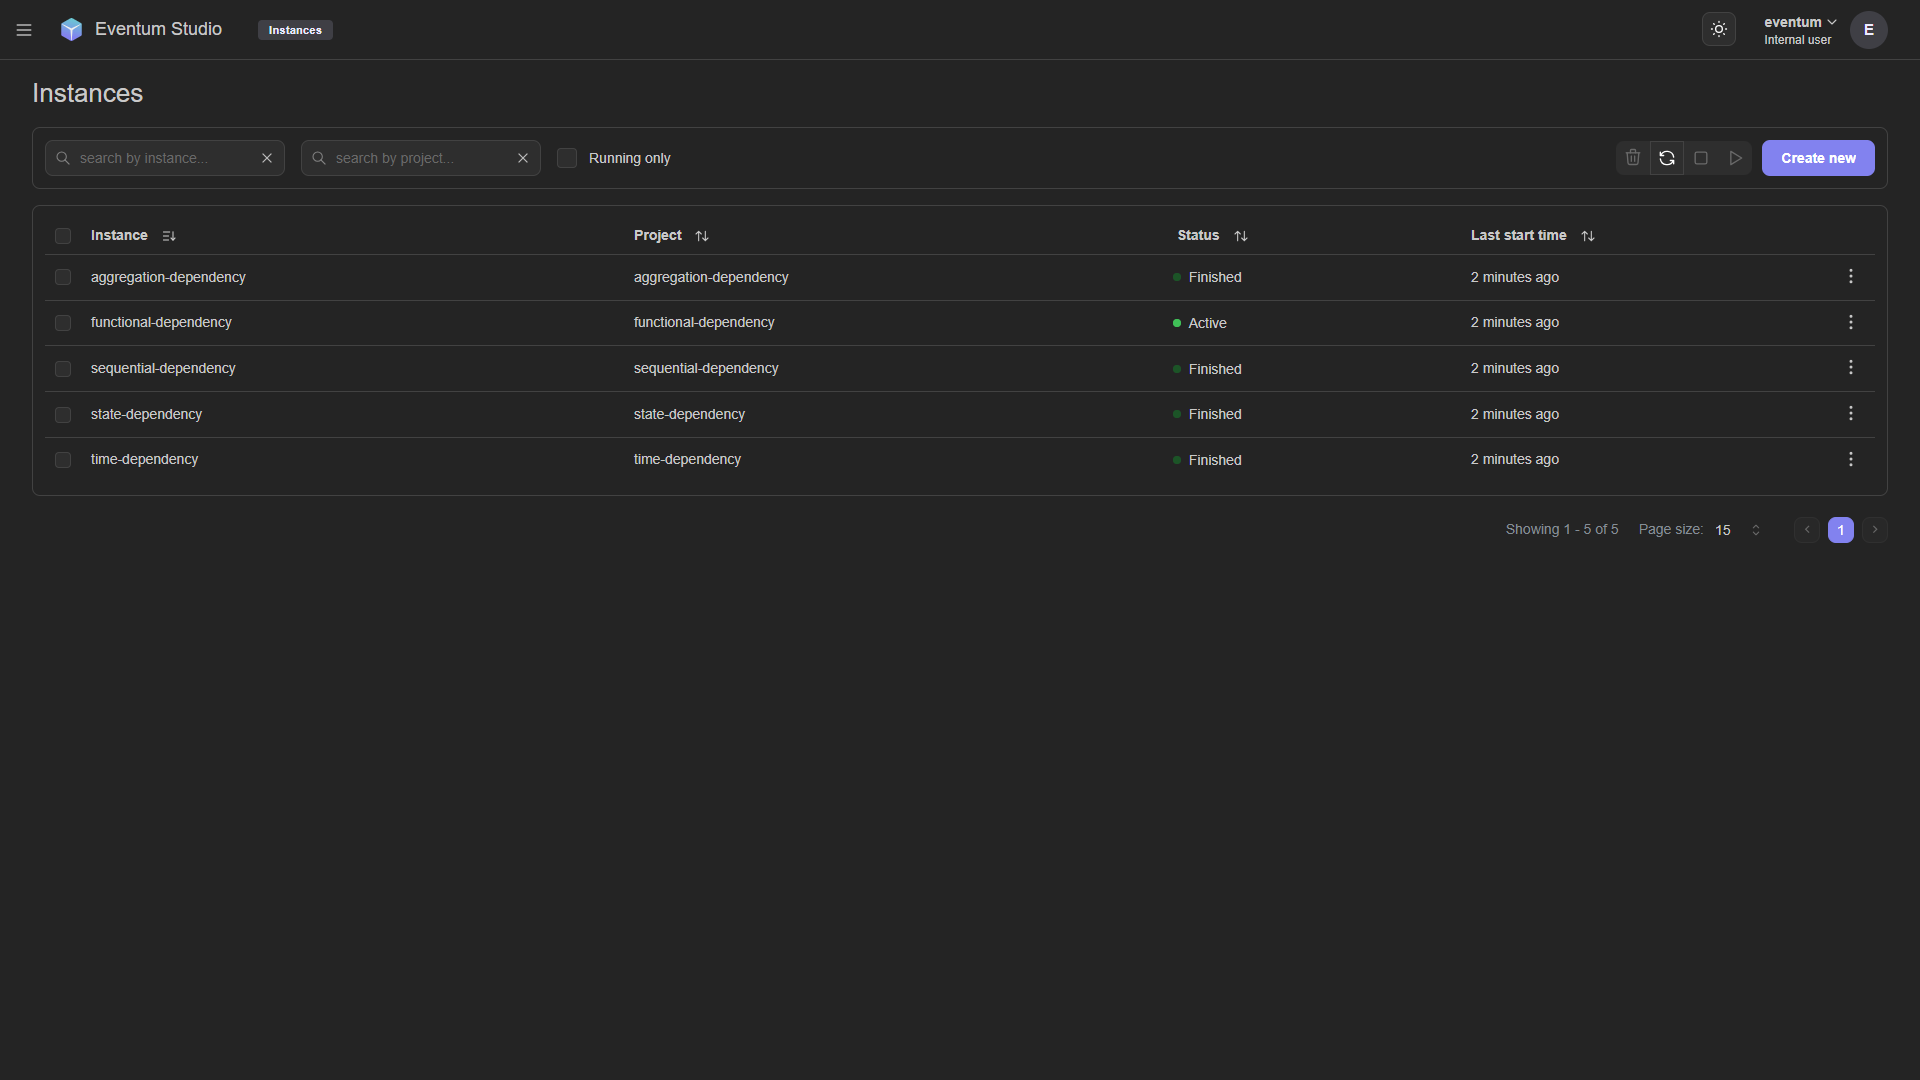
Filtering
Above the table, three filters help you narrow the list:
- Search by instance — text filter on instance IDs.
- Search by project — text filter on project names.
- Running only — checkbox to hide finished and failed instances.
Creating an instance
Click the Create new button in the top right to register a new generator instance. You'll need to specify an instance ID and select which project it should run.
Lifecycle controls
The toolbar next to the "Create new" button provides bulk actions for selected instances (use the checkboxes in each row):
| Action | Description |
|---|---|
| Delete | Remove the selected instances from the startup configuration. |
| Refresh | Refresh status of the instances. |
| Stop | Stop the selected instances. Active generators are shut down gracefully. |
| Start | Start the selected instances. Only works on instances that are currently inactive. |
Each row also has a three-dot menu on the right for per-instance actions.
Instance metrics
Clicking the metrics option on an instance opens a modal with runtime metrics and a visual pipeline diagram.
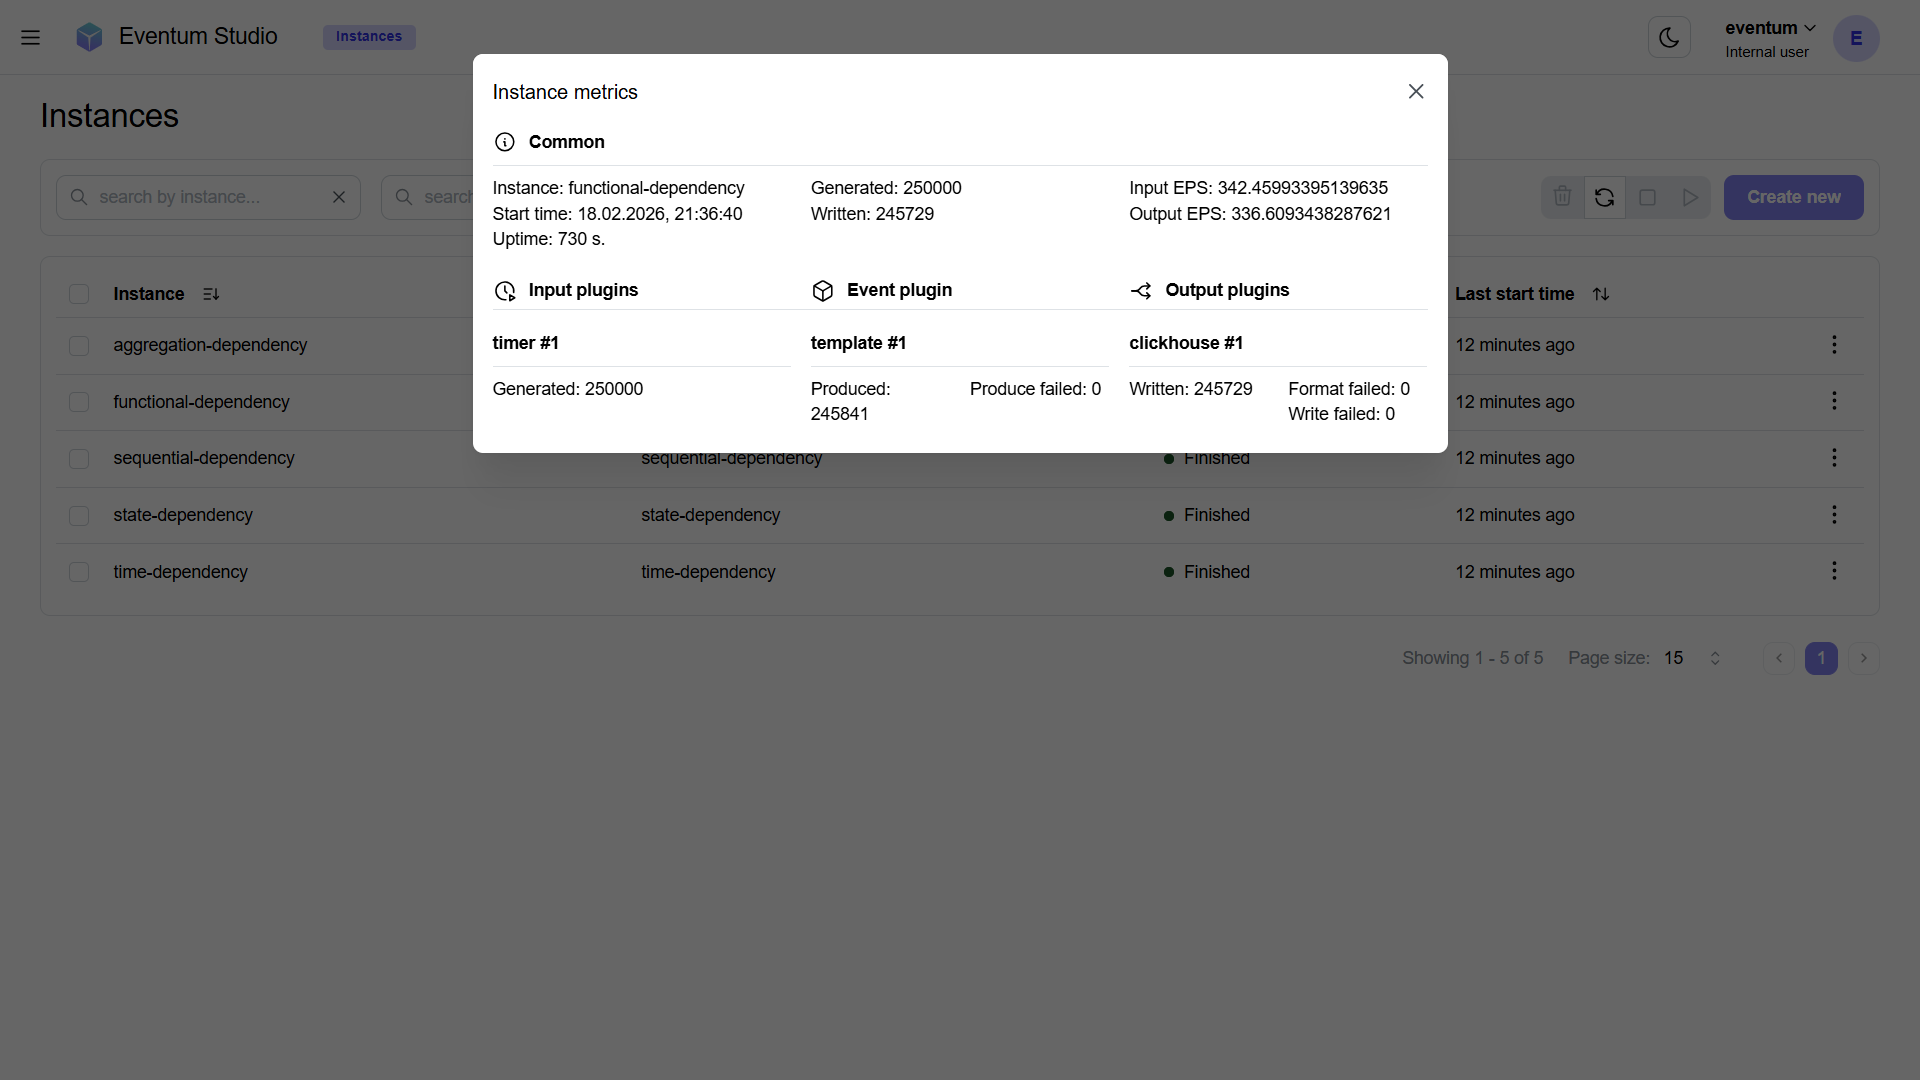
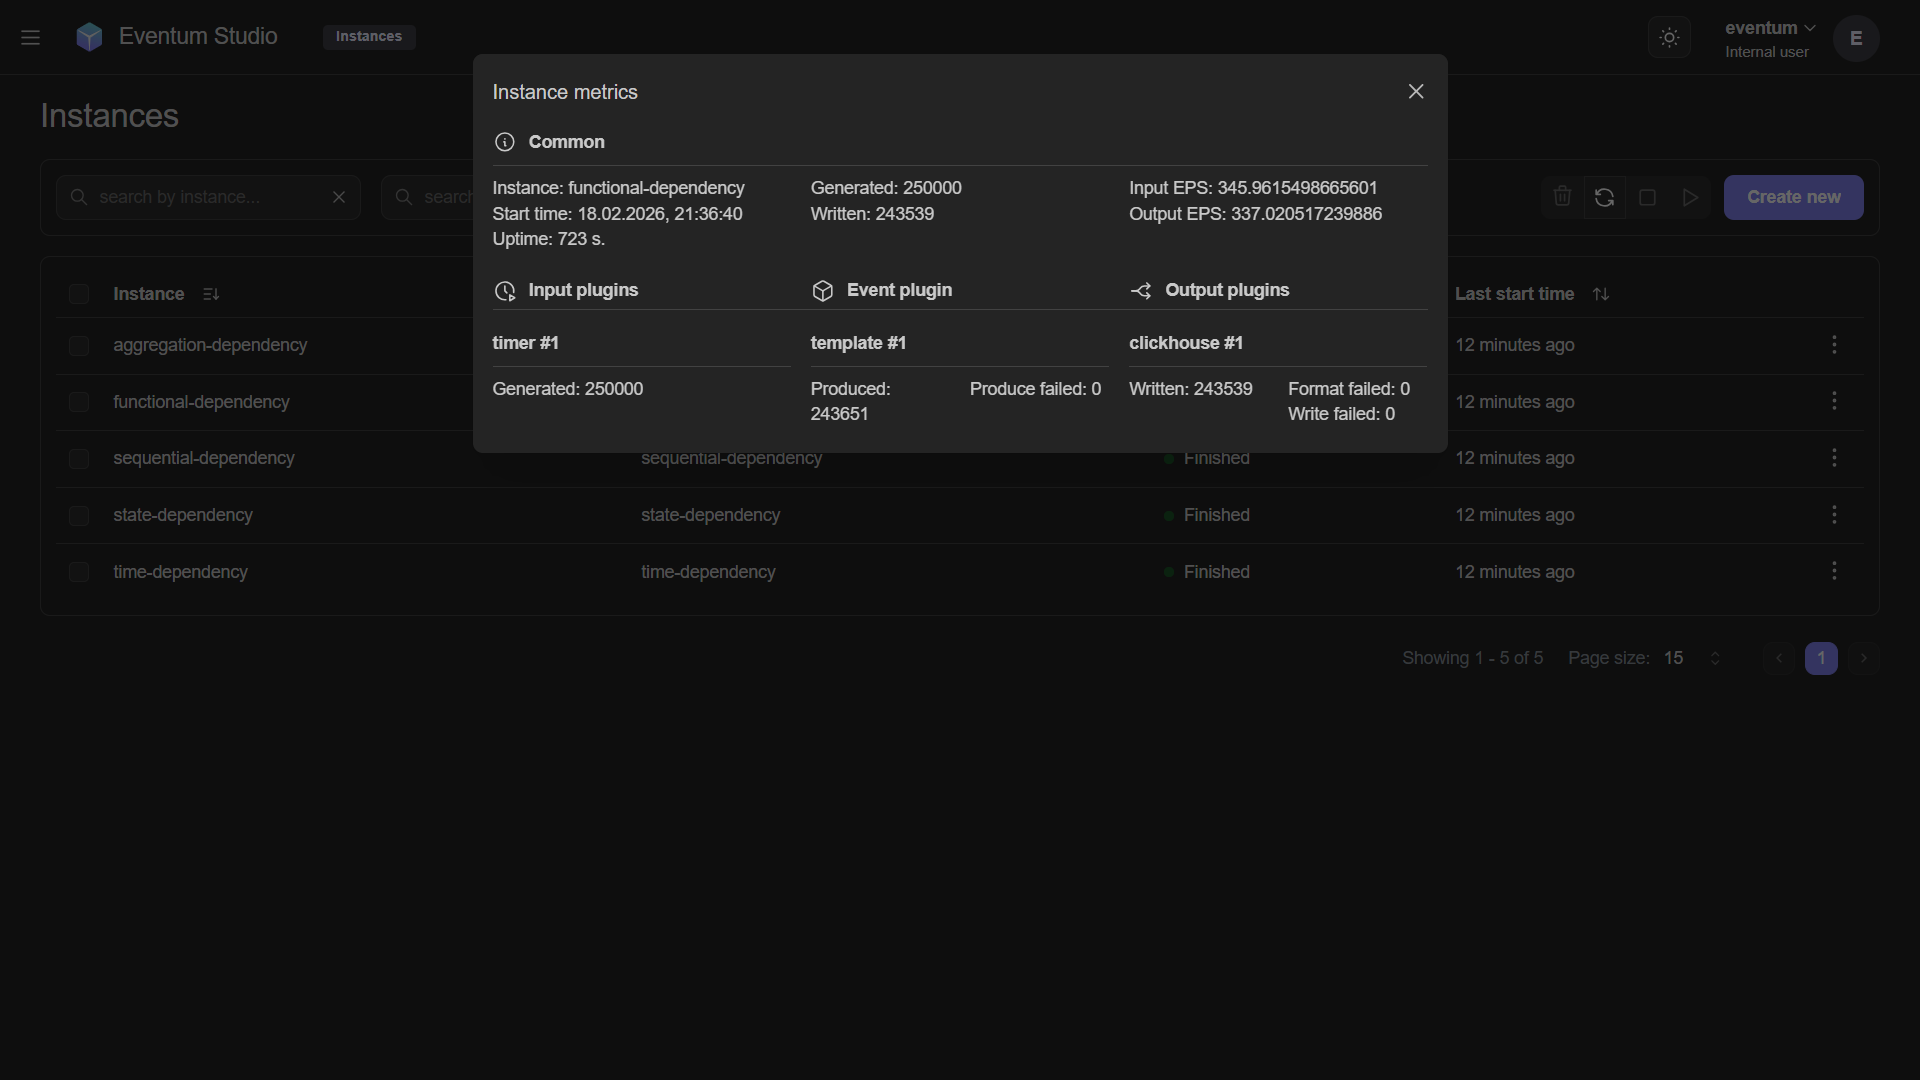
Summary counters
The top of the page shows the instance name, start time, uptime, and four aggregate counters:
| Counter | Description |
|---|---|
| Generated | Total timestamps generated by all input plugins. |
| Produced | Total events produced by the event plugin. |
| Input EPS | Current input events per second. |
| Output EPS | Current output events per second. |
Pipeline diagram
Below the counters, a visual diagram shows the full plugin pipeline of the instance — input plugins on the left, the event plugin in the center, and output plugins on the right, connected by flow lines.
Each plugin node displays its own metrics:
- Input plugins (e.g. "timer #1", "cron #1") — shows the Generated count for each plugin.
- Event plugin (e.g. "template #1") — shows the Produced count and Produce failed count.
- Output plugins (e.g. "file #1", "file #2") — shows the Written count, Format failed count, and Write failed count.
The pipeline visualization makes it easy to trace event flow from generation to delivery and pinpoint which stage is dropping events.
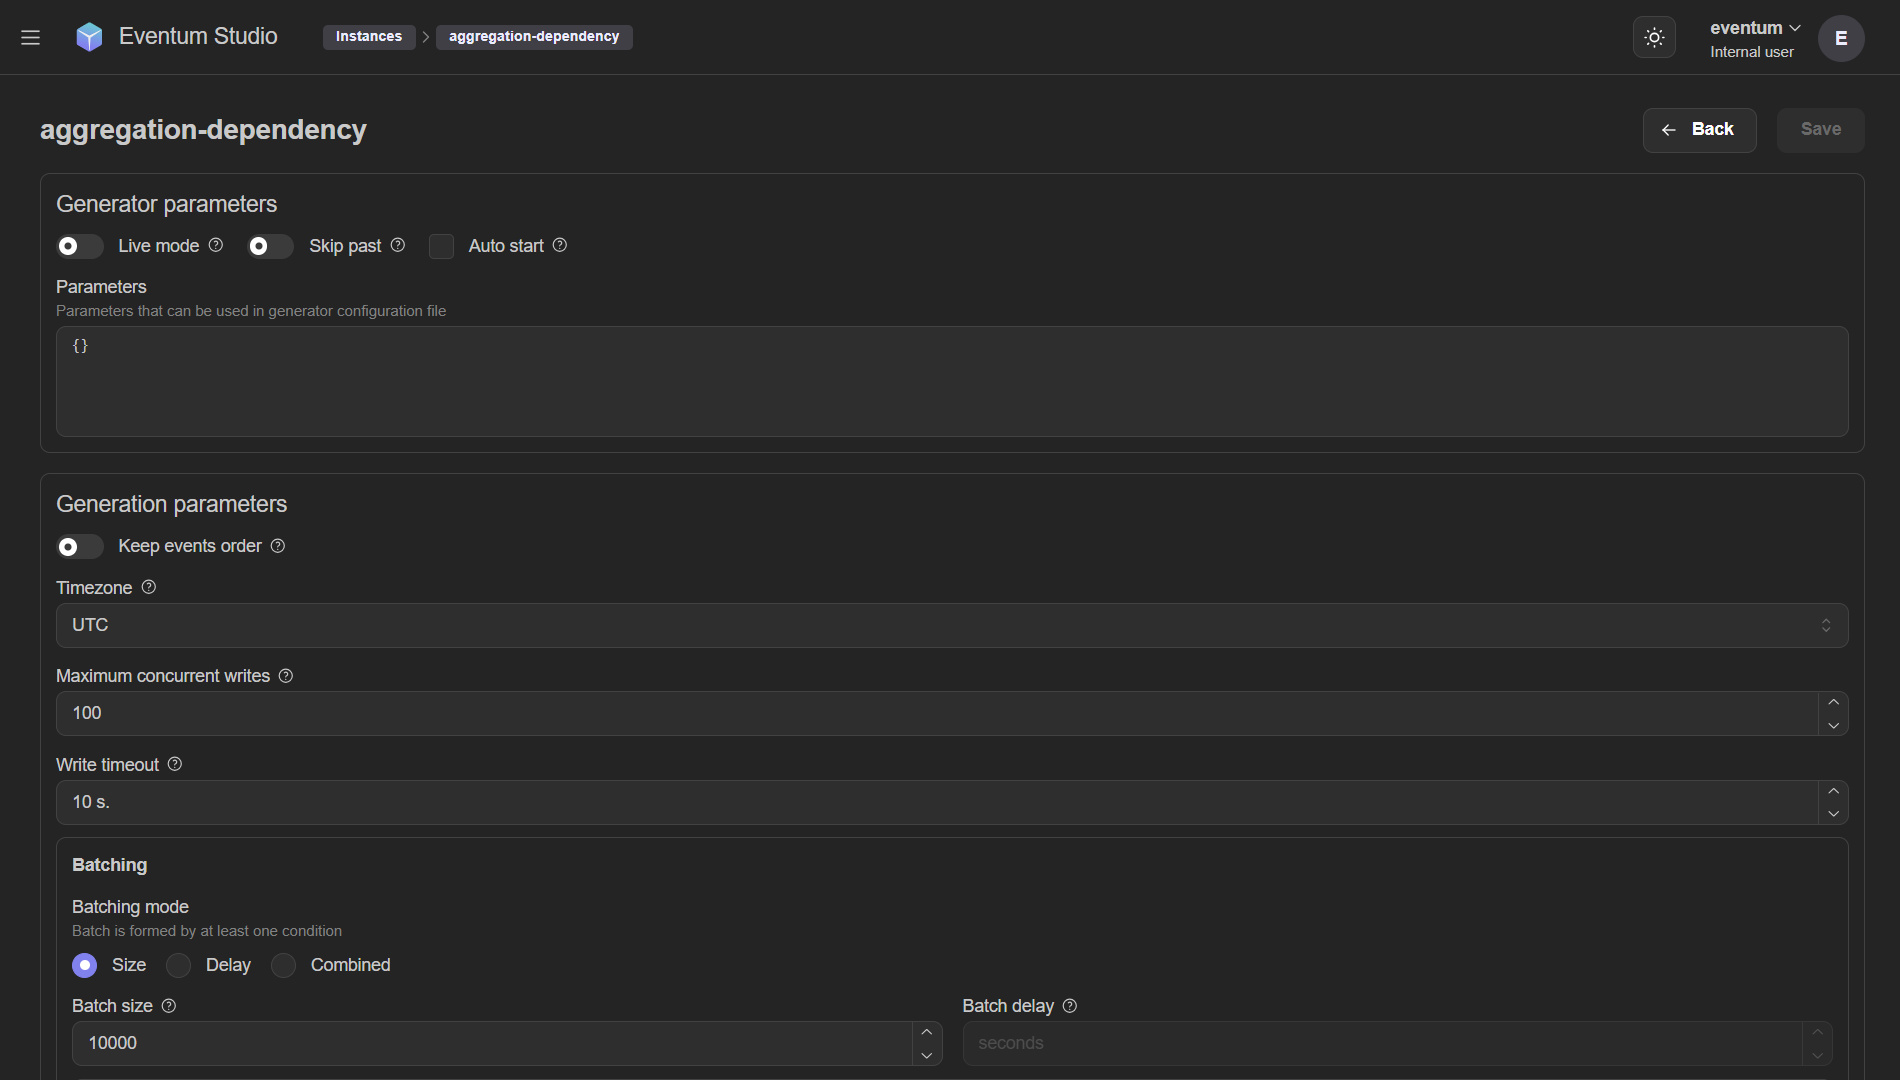
Instance settings
Opening an instance's settings shows the full configuration for that specific instance — the same fields available in startup.yml, presented as a form.
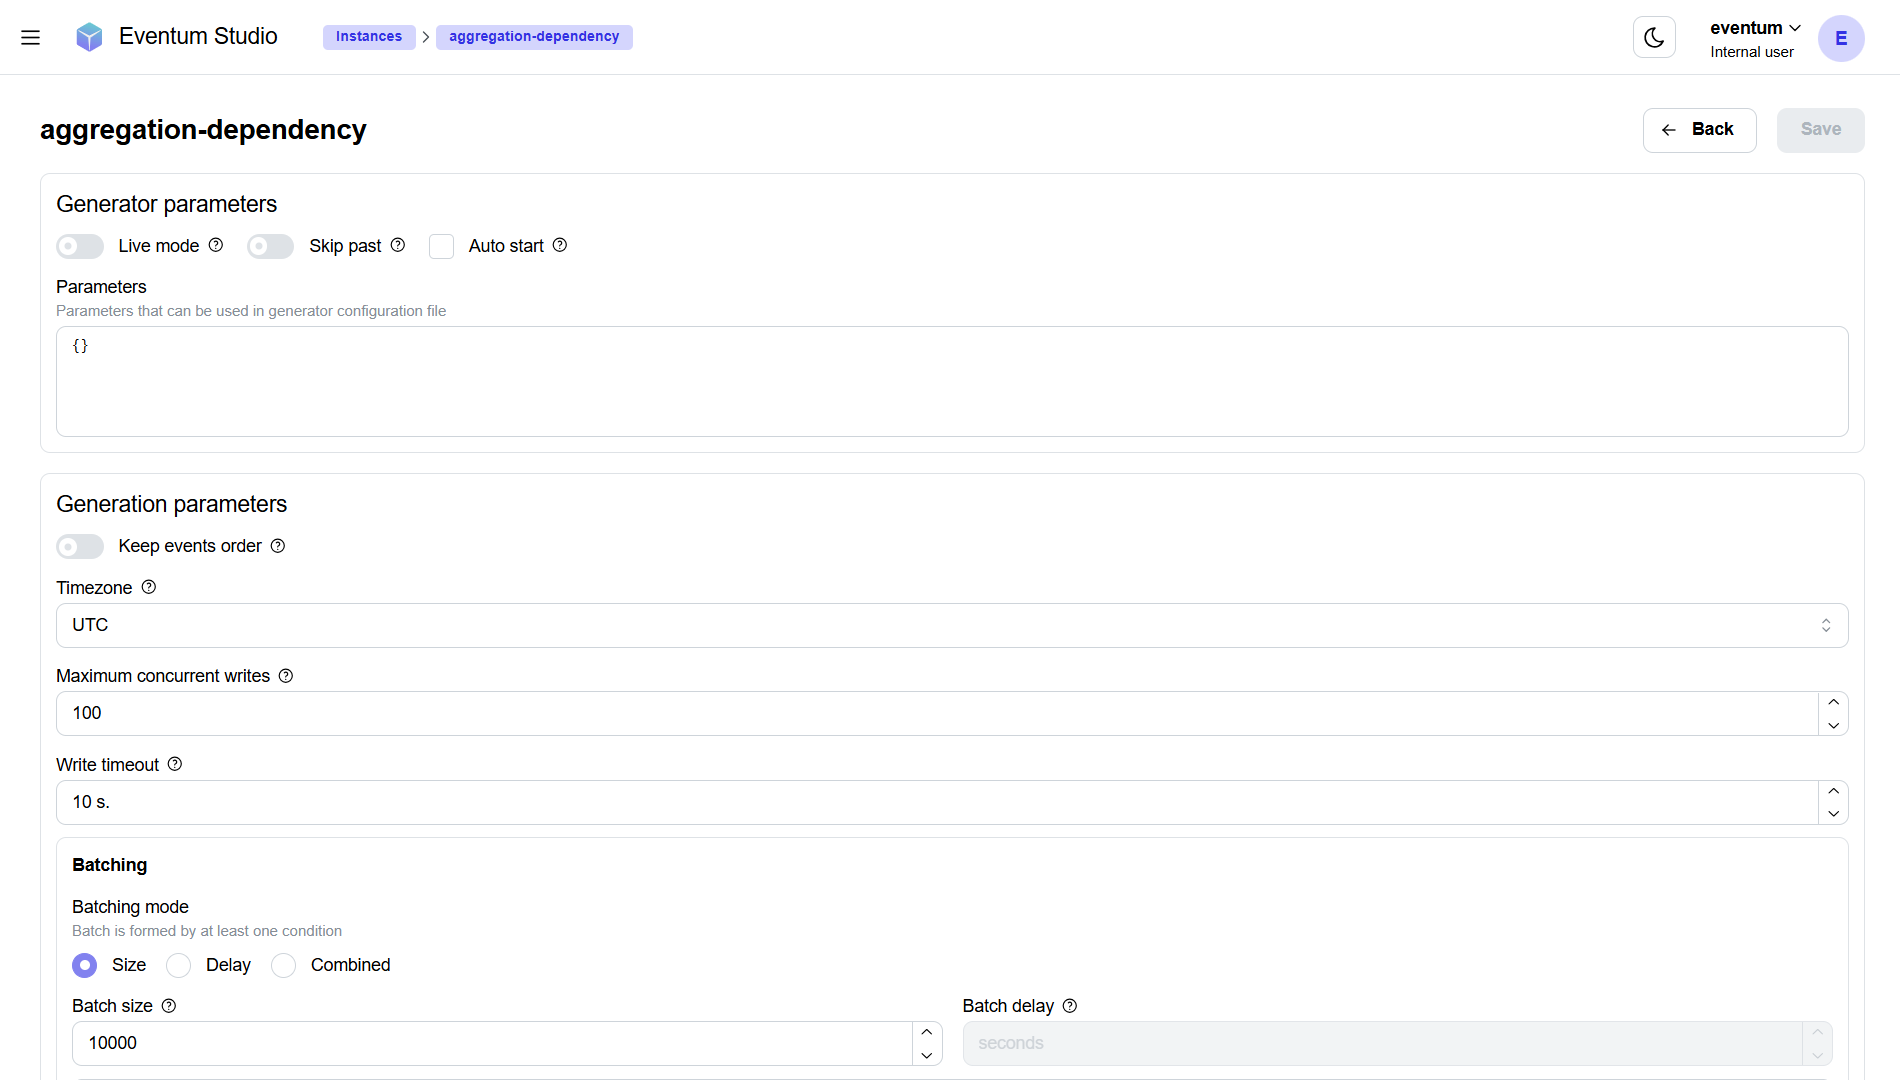
Generator parameters
The top section controls the instance's execution behavior:
| Field | Description |
|---|---|
| Live mode | Toggle between live mode (real-time) and sample mode (as fast as possible). |
| Skip past | Whether to skip timestamps that have already passed when starting in live mode. |
| Auto start | Whether the instance starts automatically when Eventum launches. |
| Parameters | A JSON editor for key-value pairs substituted into the generator config via ${params.name}. |
Generation parameters
Below the generator parameters, the generation settings allow you to override the application-level defaults for this specific instance.
Click Save to persist changes. Changes take effect on the next start of the instance.
Instance logs
The log viewer shows the runtime log output for a specific instance. This is the same information written to the log files on disk, but accessible directly in the browser.
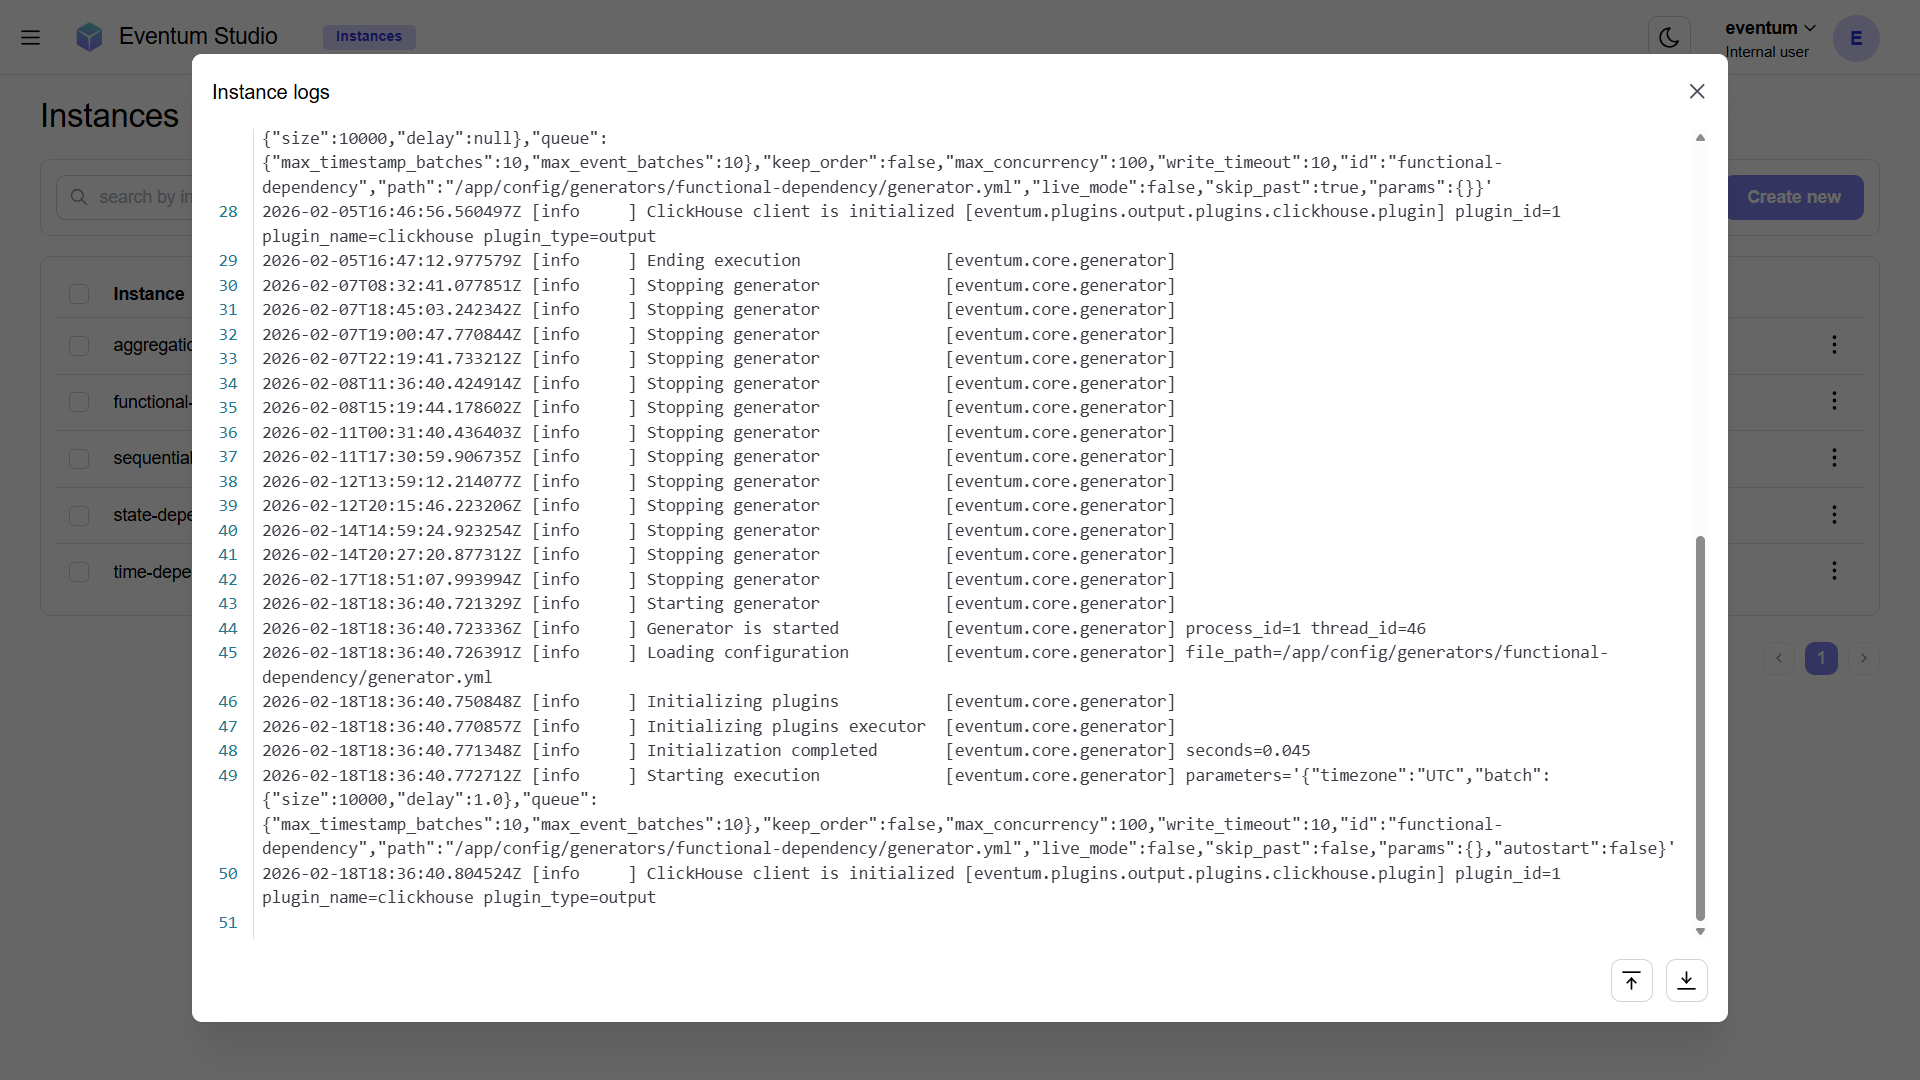
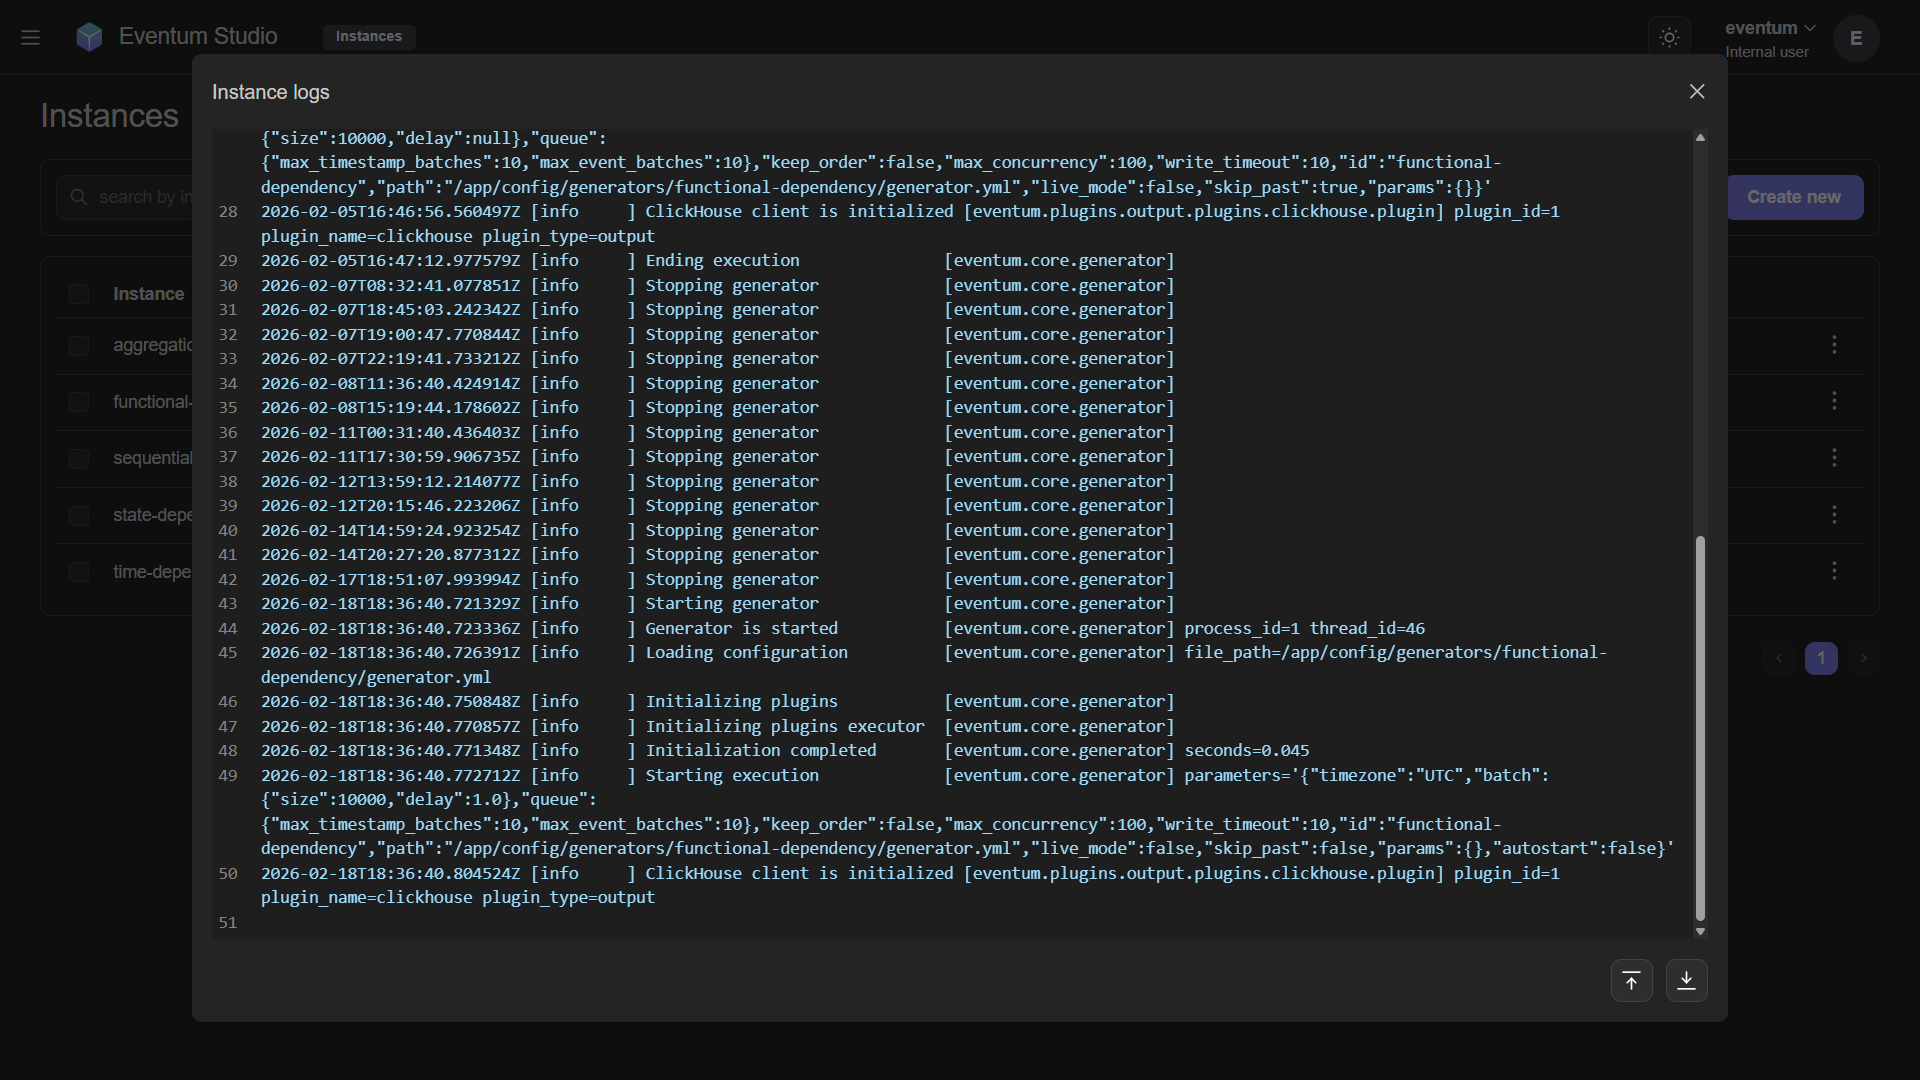
Logs are displayed as a scrollable text area with:
- Structured log entries showing timestamp, level (INFO, DEBUG, WARNING, ERROR), message, and context fields.
- The full startup sequence — config loading, plugin initialization, generator start.
- Runtime events — generation progress, errors, and completion status.
Scenarios
Group generator instances into named scenarios for coordinated lifecycle control, global state management, and data flow visualization.
Projects
Generator projects in Studio — the project list, the visual plugin editor with input preview, event debugger, output formatter testing, and file management.