Monitoring
Real-time system monitoring — resource gauges, event flow statistics, throughput charts, and instance status.
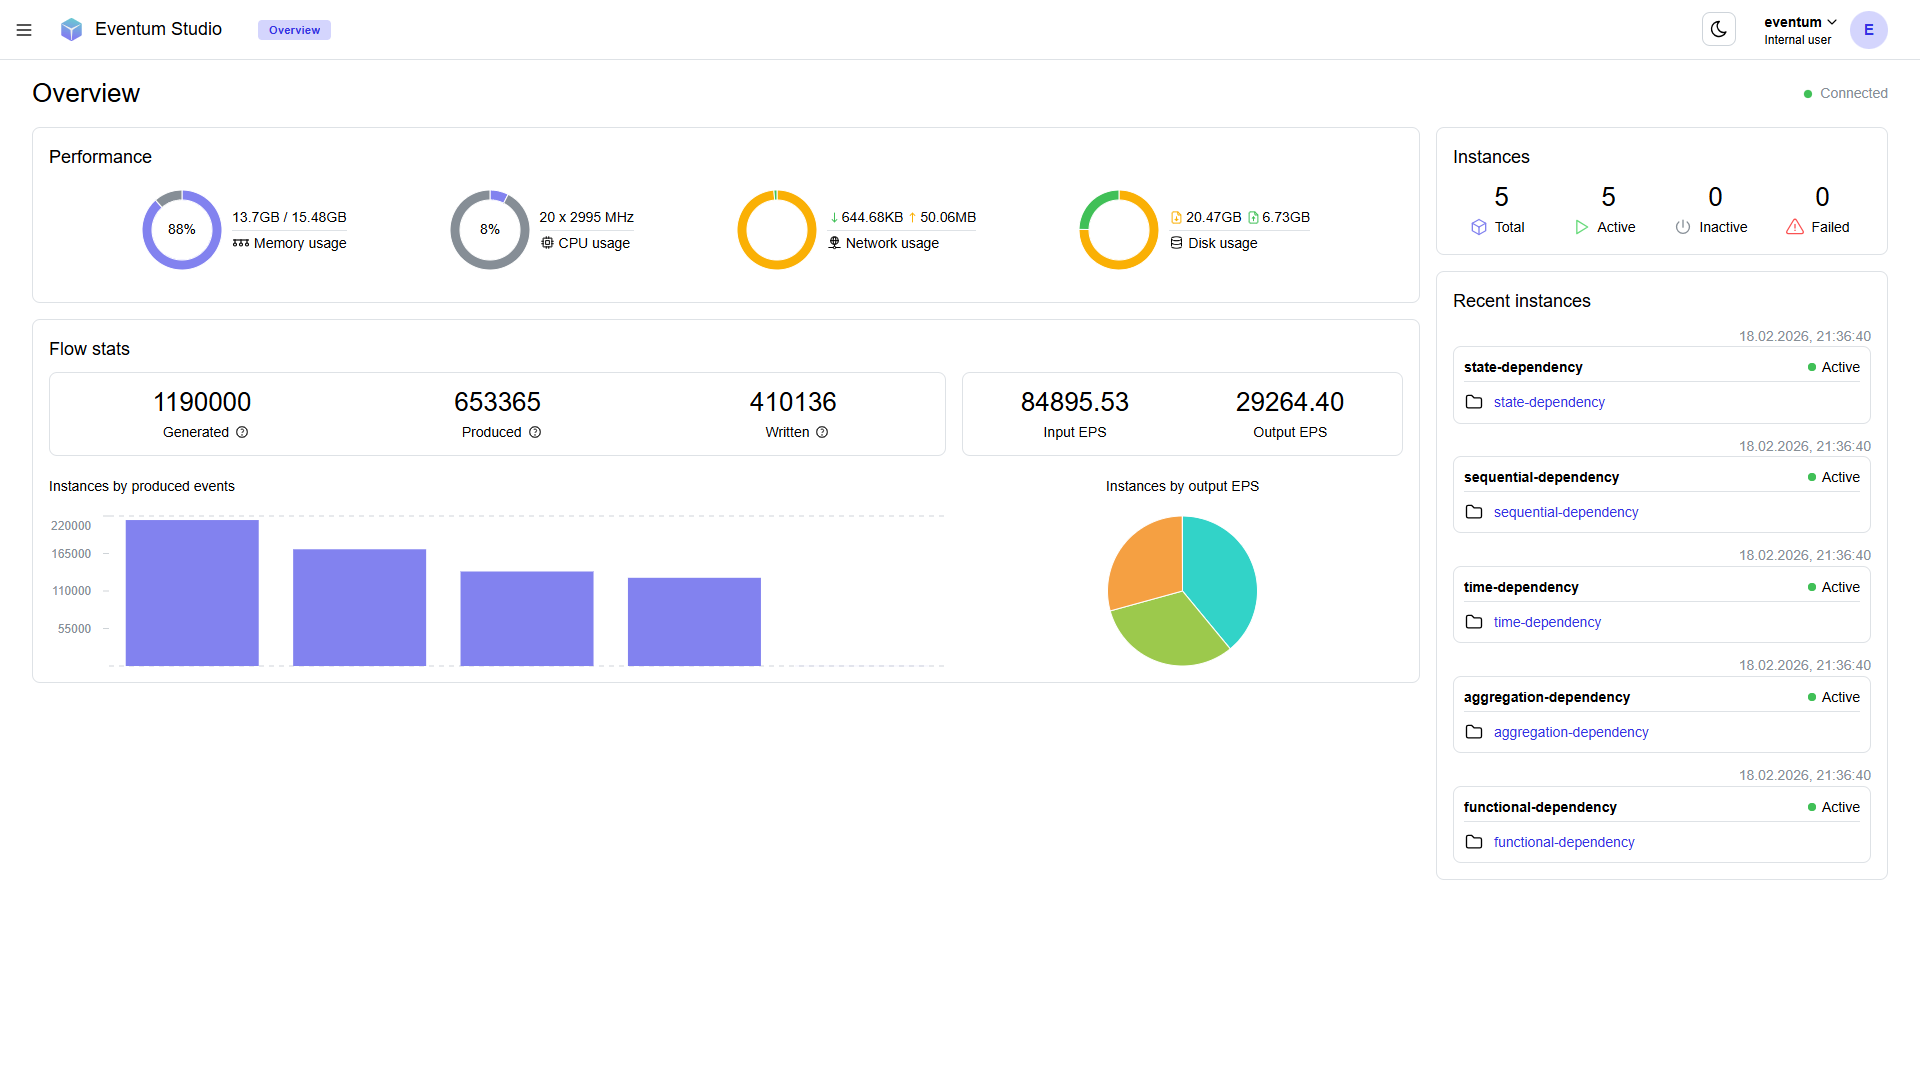
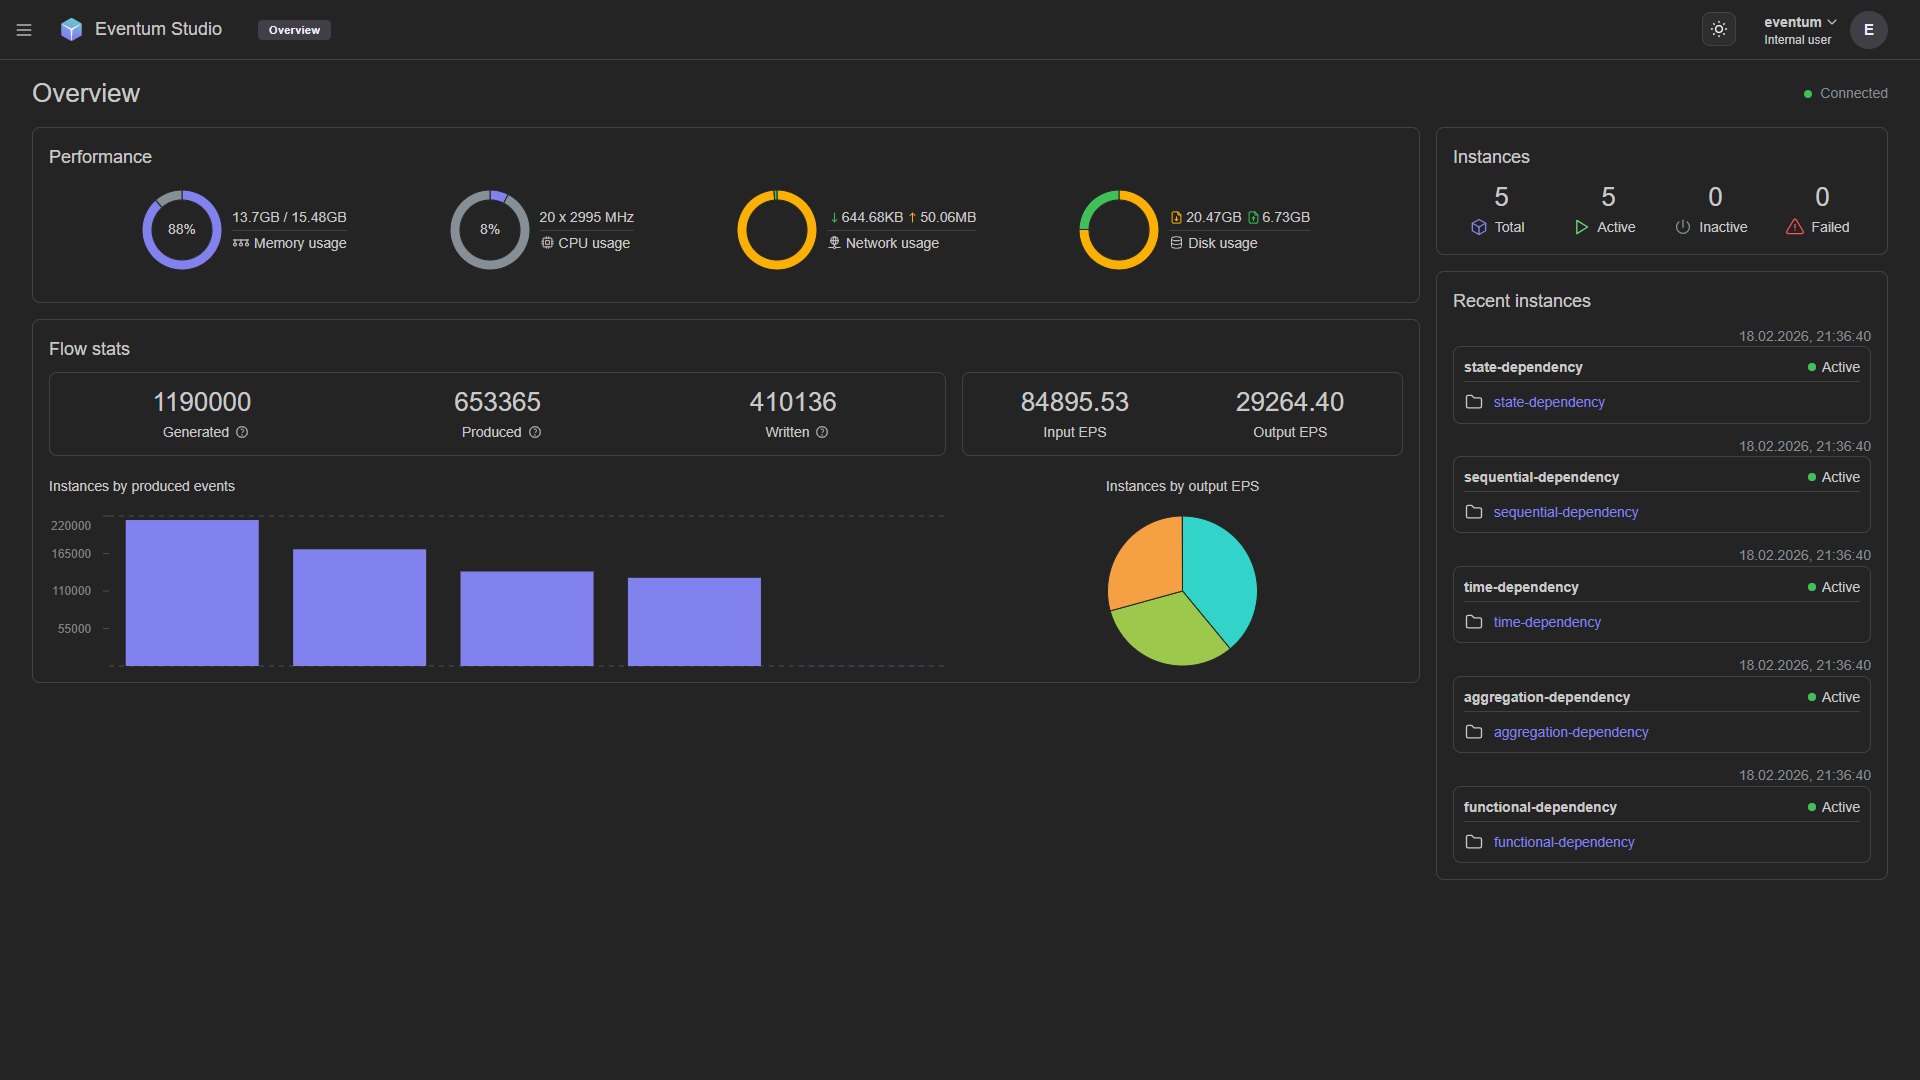
The Monitoring page is a real-time dashboard for the running Eventum instance. All values update automatically while the page is open.
Performance
Four gauges show host-level resource usage: memory, CPU, network I/O, and disk I/O.
Flow stats
Five counters summarize aggregate event throughput: Generated (timestamps from input plugins) → Produced (events from the event plugin) → Written (events delivered by output plugins), plus Input EPS and Output EPS.
The difference between Generated, Produced, and Written reflects events lost to produce/write failures or still queued for processing.
Charts
- Instances by produced events — shows which generators are the most active.
- Instances by output EPS — shows how output throughput is distributed across instances.
Instances sidebar
The right panel shows instance totals (active, inactive, failed) and a recent activity list with links to each instance's scenario and project.