Overview dashboard
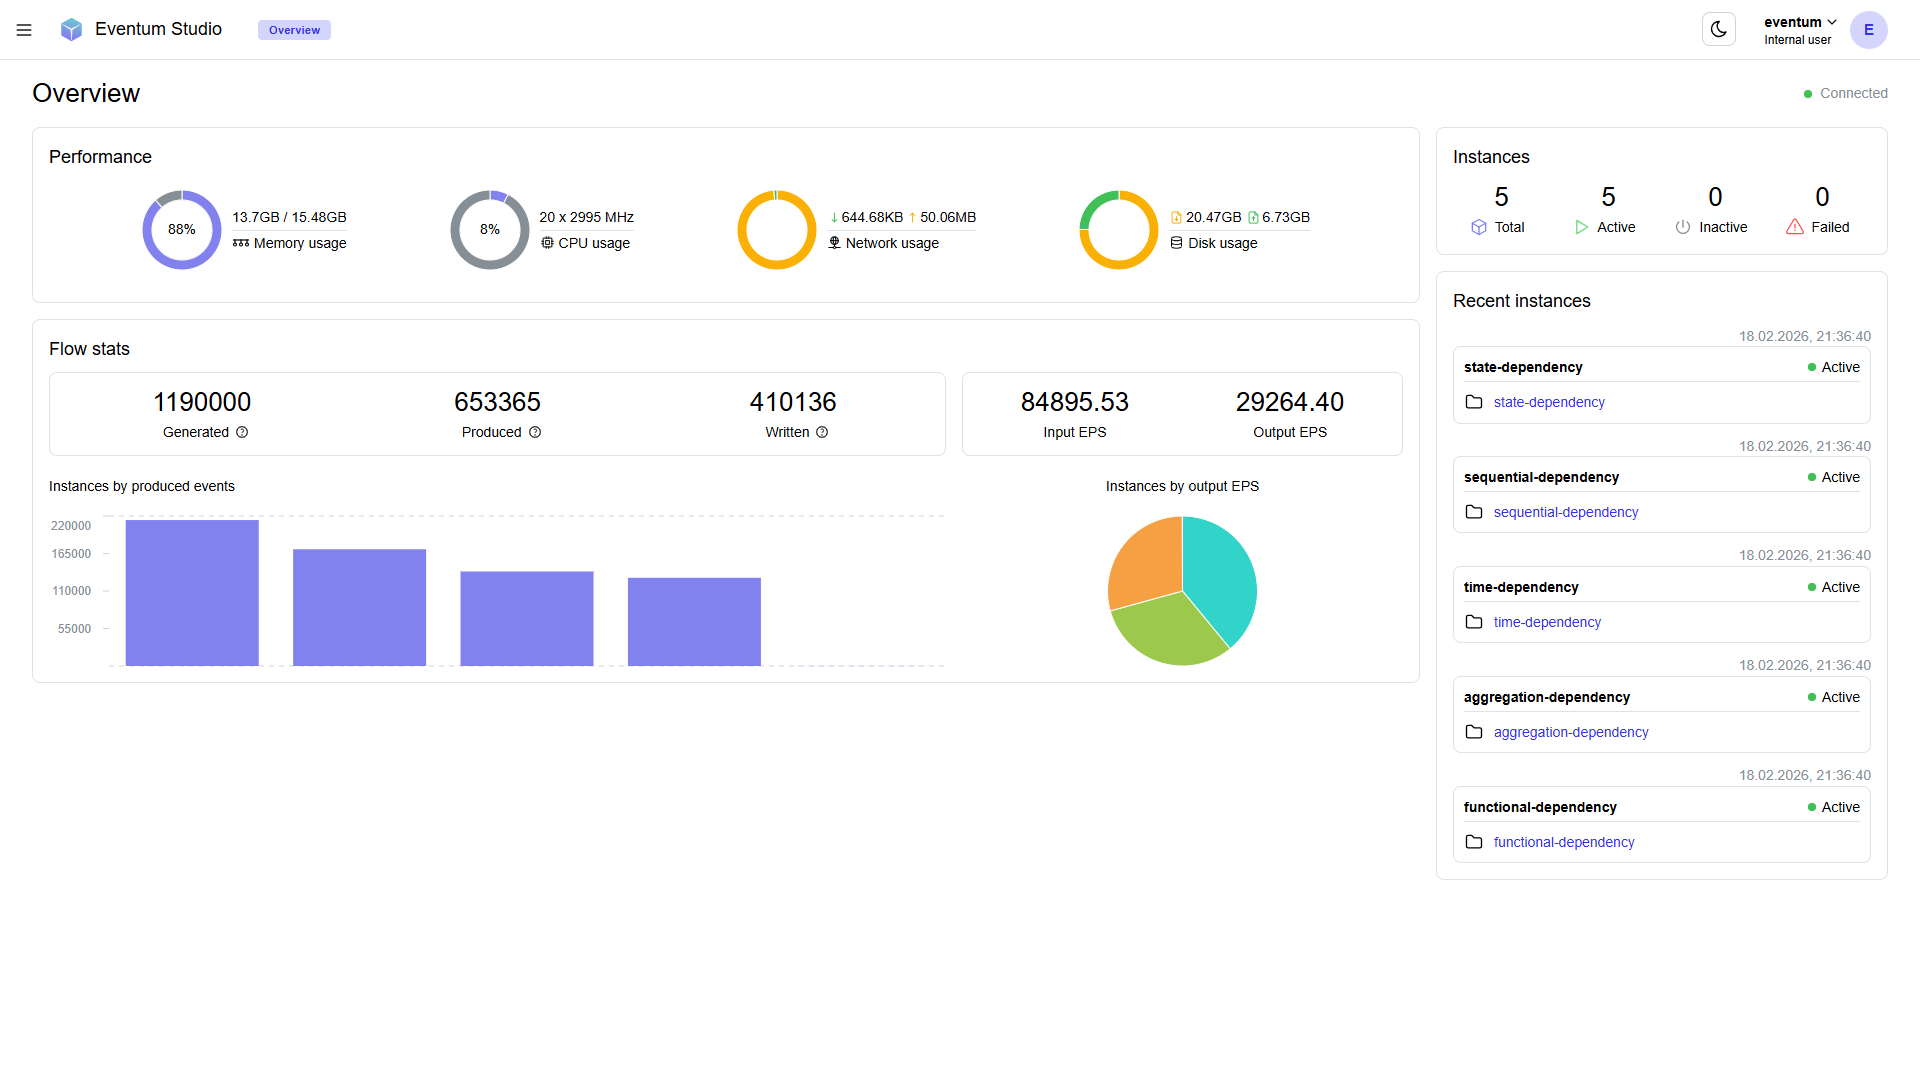
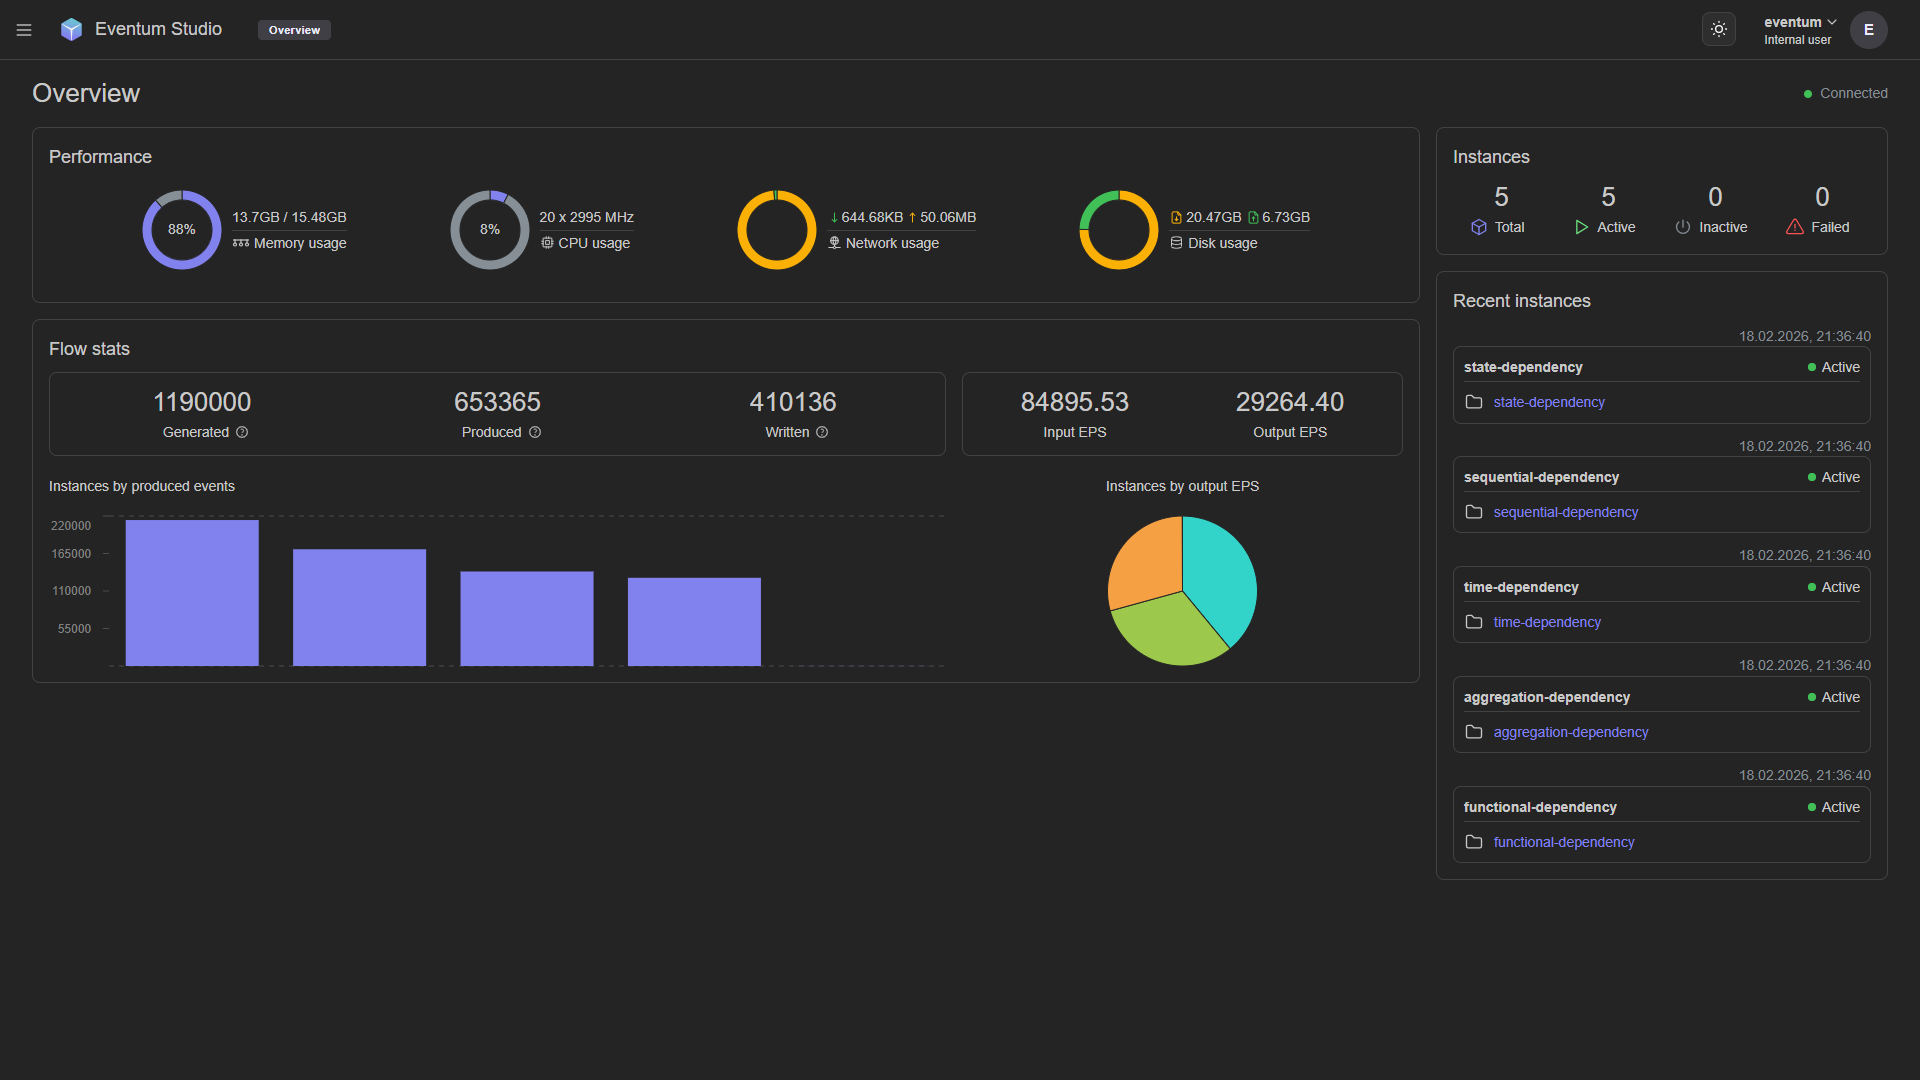
The Studio home screen — system resource gauges, event flow statistics, throughput charts, and a live instance sidebar.
The Overview page is the first thing you see when you open Studio. It provides a real-time snapshot of the system — resource consumption, event flow statistics, throughput charts, and the status of all generator instances.
Performance
The top section displays four resource gauges:
| Gauge | What it shows |
|---|---|
| Memory usage | Current and total RAM (e.g. 13.7 GB / 15.48 GB, 88%). |
| CPU usage | Number of cores and clock speed (e.g. 20 x 2995 MHz, 8%). |
| Network usage | Currently downloaded and uploaded bytes (e.g. 644.68 KB down, 50.06 MB up). |
| Disk usage | Currently written and read bytes (e.g. 20.47 GB write, 6.73 GB read). |
These values update in real time while the page is open.
Flow stats
Below the performance gauges, five counters summarize the total event throughput across all generators:
| Counter | Description |
|---|---|
| Generated | Total number of timestamps generated by all input plugins. |
| Produced | Total number of events produced by event plugins from those timestamps. |
| Written | Total number of events successfully delivered by output plugins. |
| Input EPS | Current events per second at the input stage. |
| Output EPS | Current events per second at the output stage. |
The difference between Generated, Produced, and Written reflects events that were lost to produce failures, write failures, or events still in internal queues waiting to be processed.
Charts
Two visualizations appear below the flow stats:
- Instances by produced events — a bar chart showing how many events each instance has produced. This helps you spot which generators are the most active and whether load is distributed as expected.
- Instances by output EPS — a pie chart showing the share of output throughput per instance. Useful for identifying which generators are consuming the most write bandwidth.
Instances sidebar
The right-hand panel shows a summary of all registered generator instances:
- Totals — counts for Total, Active, Inactive, and Failed instances.
- Recent instances — a list of instances ordered by most recent activity, each showing:
- Instance name and status indicator (green dot for Active, grey for Inactive).
- A link to the instance's project for quick navigation.
- Timestamp of the last status change.
This sidebar gives you a quick way to check whether all expected generators are running without leaving the dashboard.