Projects
Generator projects in Studio — the project list, the visual plugin editor with input preview, event debugger, output formatter testing, and file management.
A project in Studio corresponds to a generator directory on disk — a generator.yml file and its supporting resources (templates, scripts, samples, pattern files). The Projects section lets you browse, create, and visually edit generator configurations without touching YAML directly.
Project list
The Projects page shows all generator directories discovered under the configured generators_dir path.
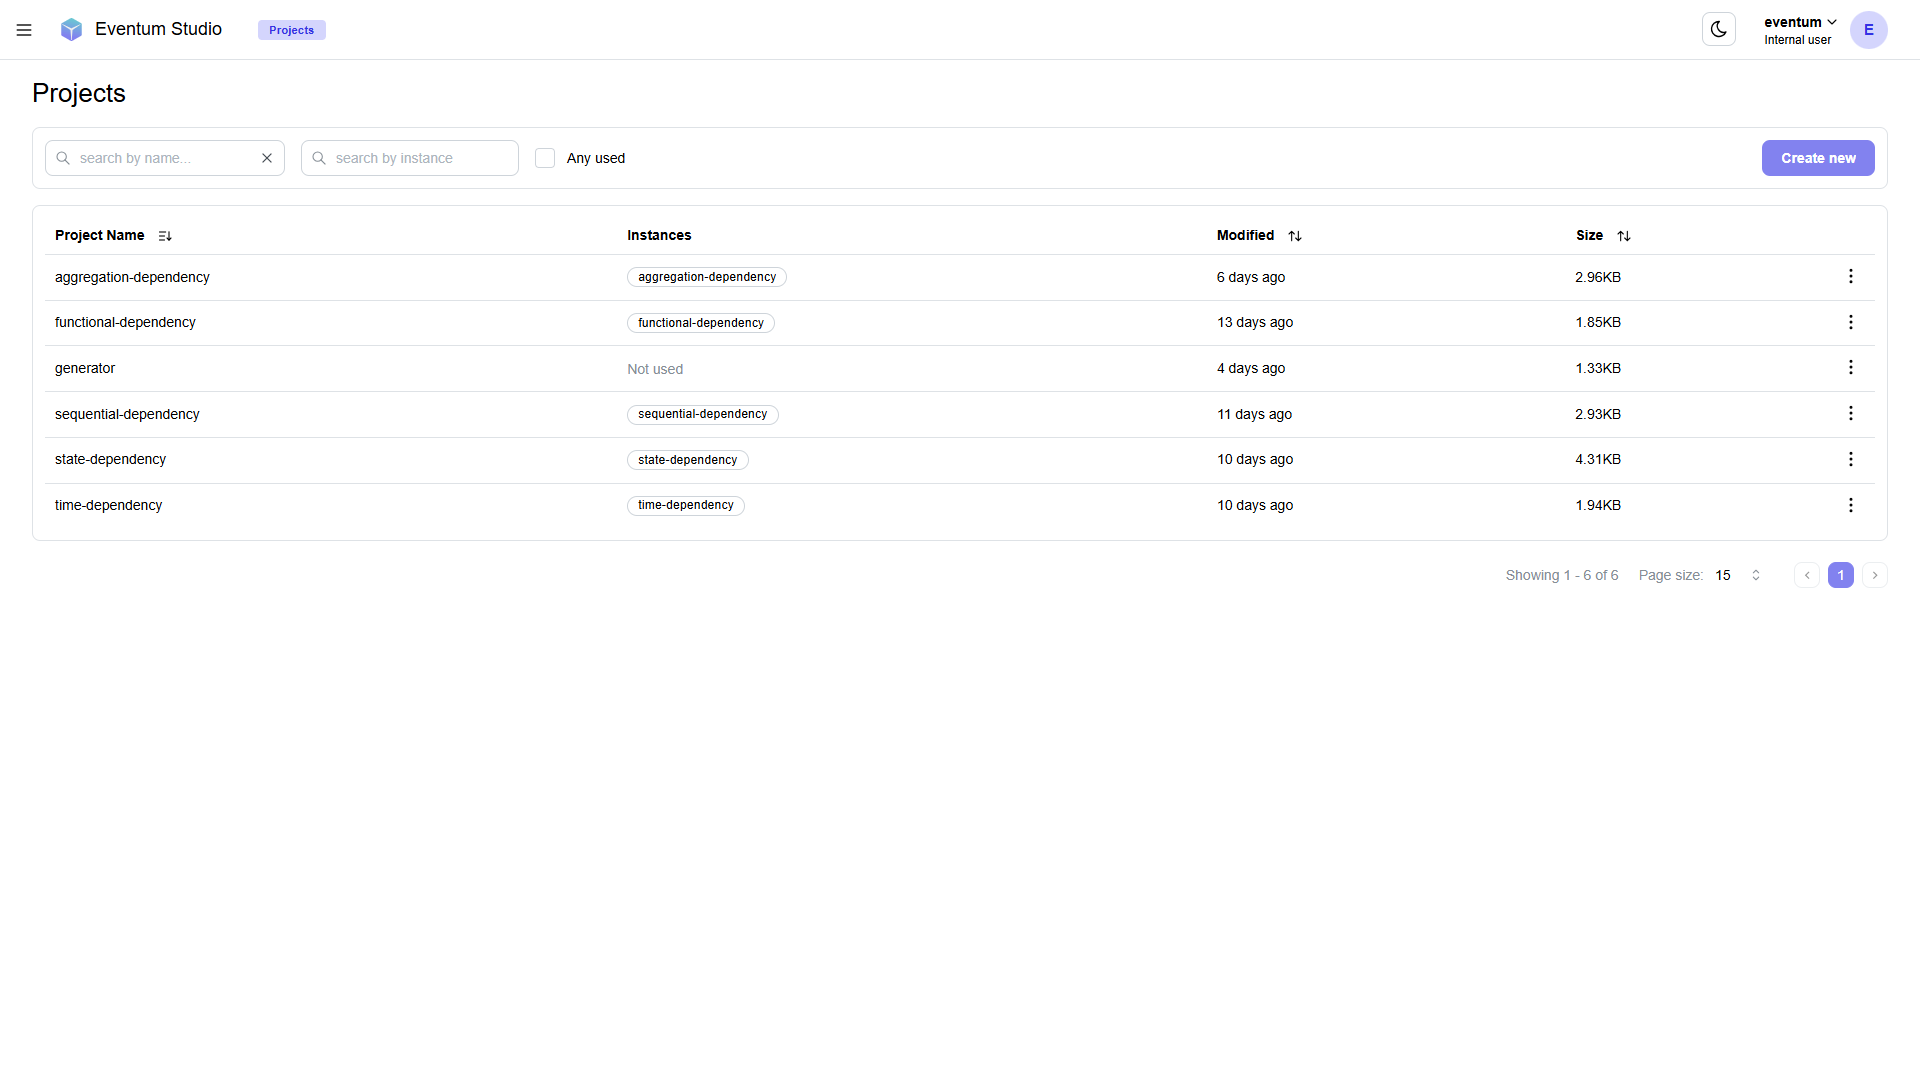
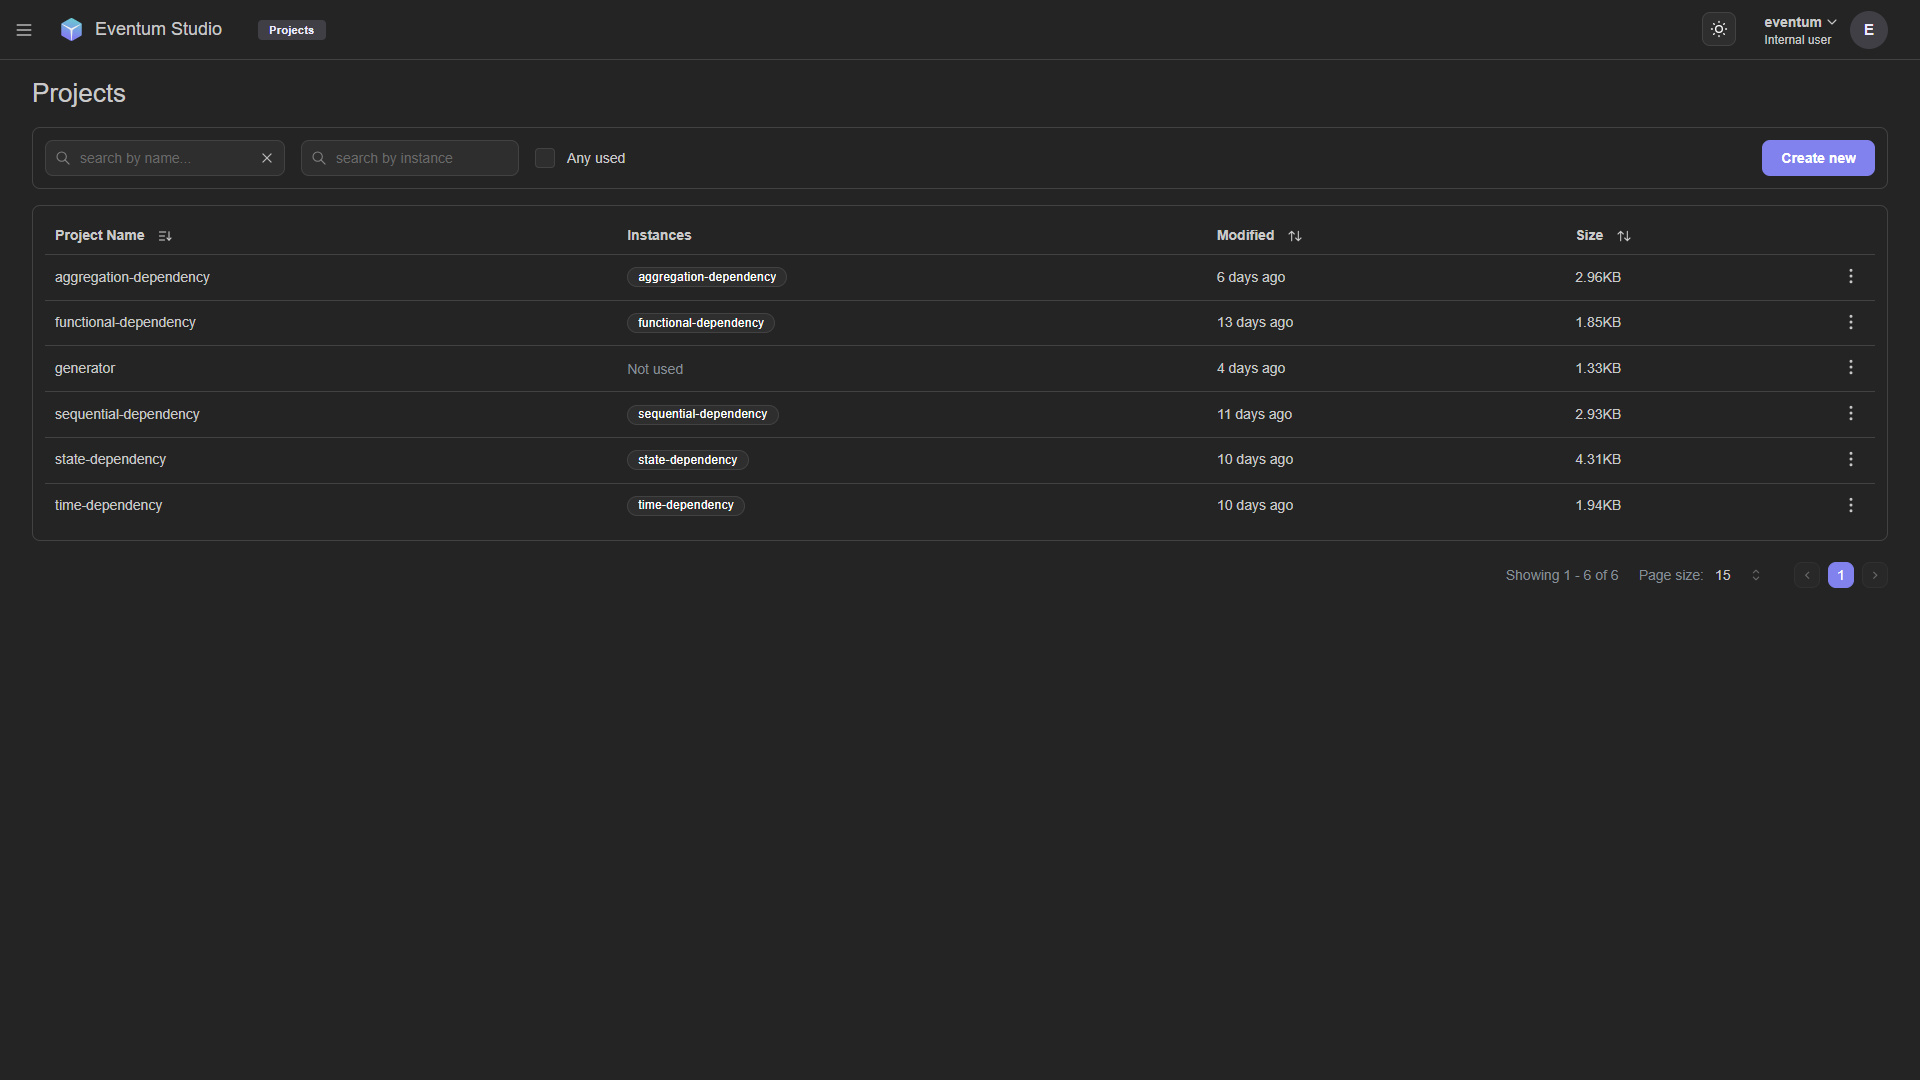
The table has the following columns:
| Column | Description |
|---|---|
| Project Name | The name of the generator directory. Click to open the project editor. |
| Instances | Badges showing which instances are using this project. A project with no instances shows "Not used". |
| Modified | When the project was last modified (relative time). |
| Size | Total size of all files in the project directory. |
Filtering
- Search by name — text filter on project names.
- Search by instance — text filter on associated instance names.
- Any used — checkbox to show only projects that have at least one instance.
Click Create new to scaffold a new generator project.
Each row has a three-dot menu for actions like deleting or duplicating the project.
Project editor
Clicking a project name opens the full-screen editor. The editor is divided into three main tabs — Input plugins, Event plugin, and Output plugins — matching the three stages of the generator pipeline.
All three tabs share a consistent layout:
- Left sidebar — plugin list and file tree.
- Center workspace — plugin-specific tools (preview, debugger, editor, formatter).
- Right sidebar — plugin parameters form.
- Top right — Back button to return to the project list, and Save button to persist changes to disk.
File tree
The bottom-left panel on every tab shows the project's file tree — all files and directories inside the generator directory. Files are displayed with type-appropriate icons (templates, YAML configs, data files, markdown). You can browse the structure, select files to edit, upload and create new files and directories.
Input plugins tab
The Input plugins tab lets you configure and preview input plugins — the scheduling stage that determines when events are generated.
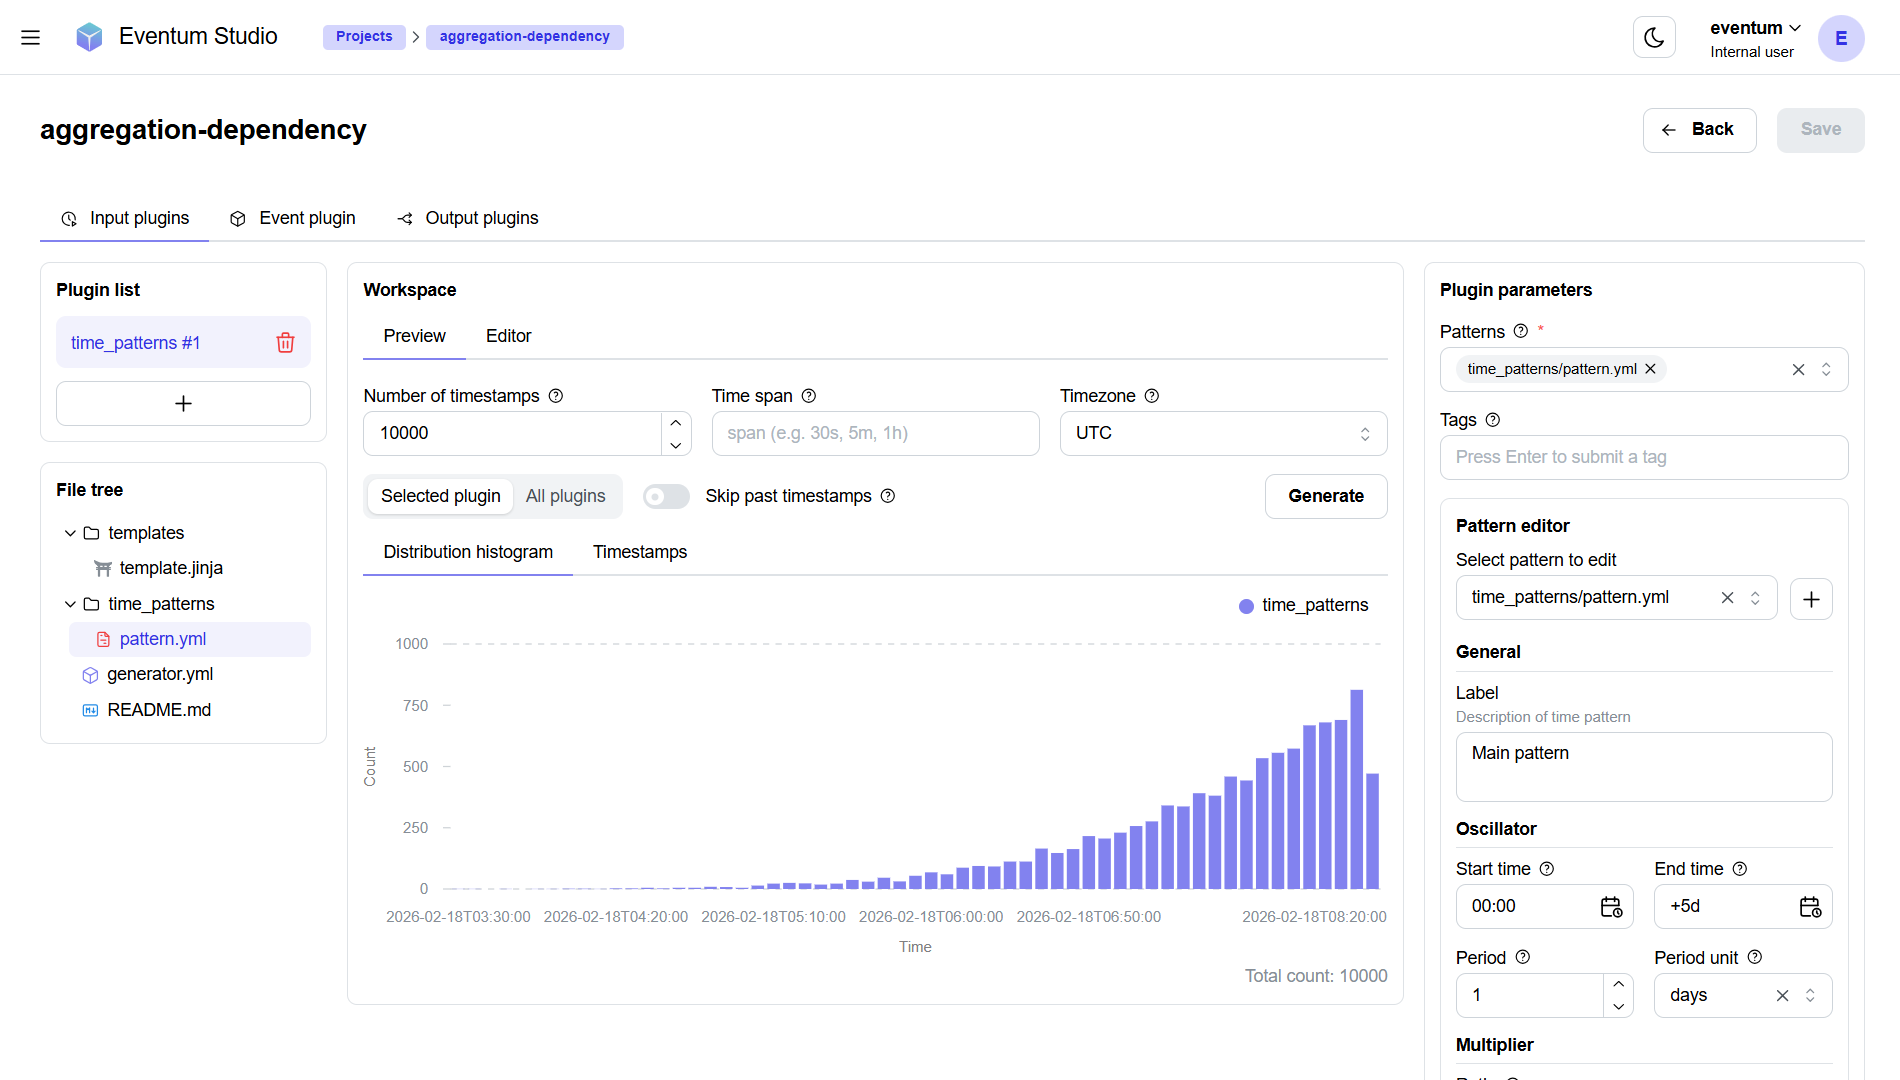
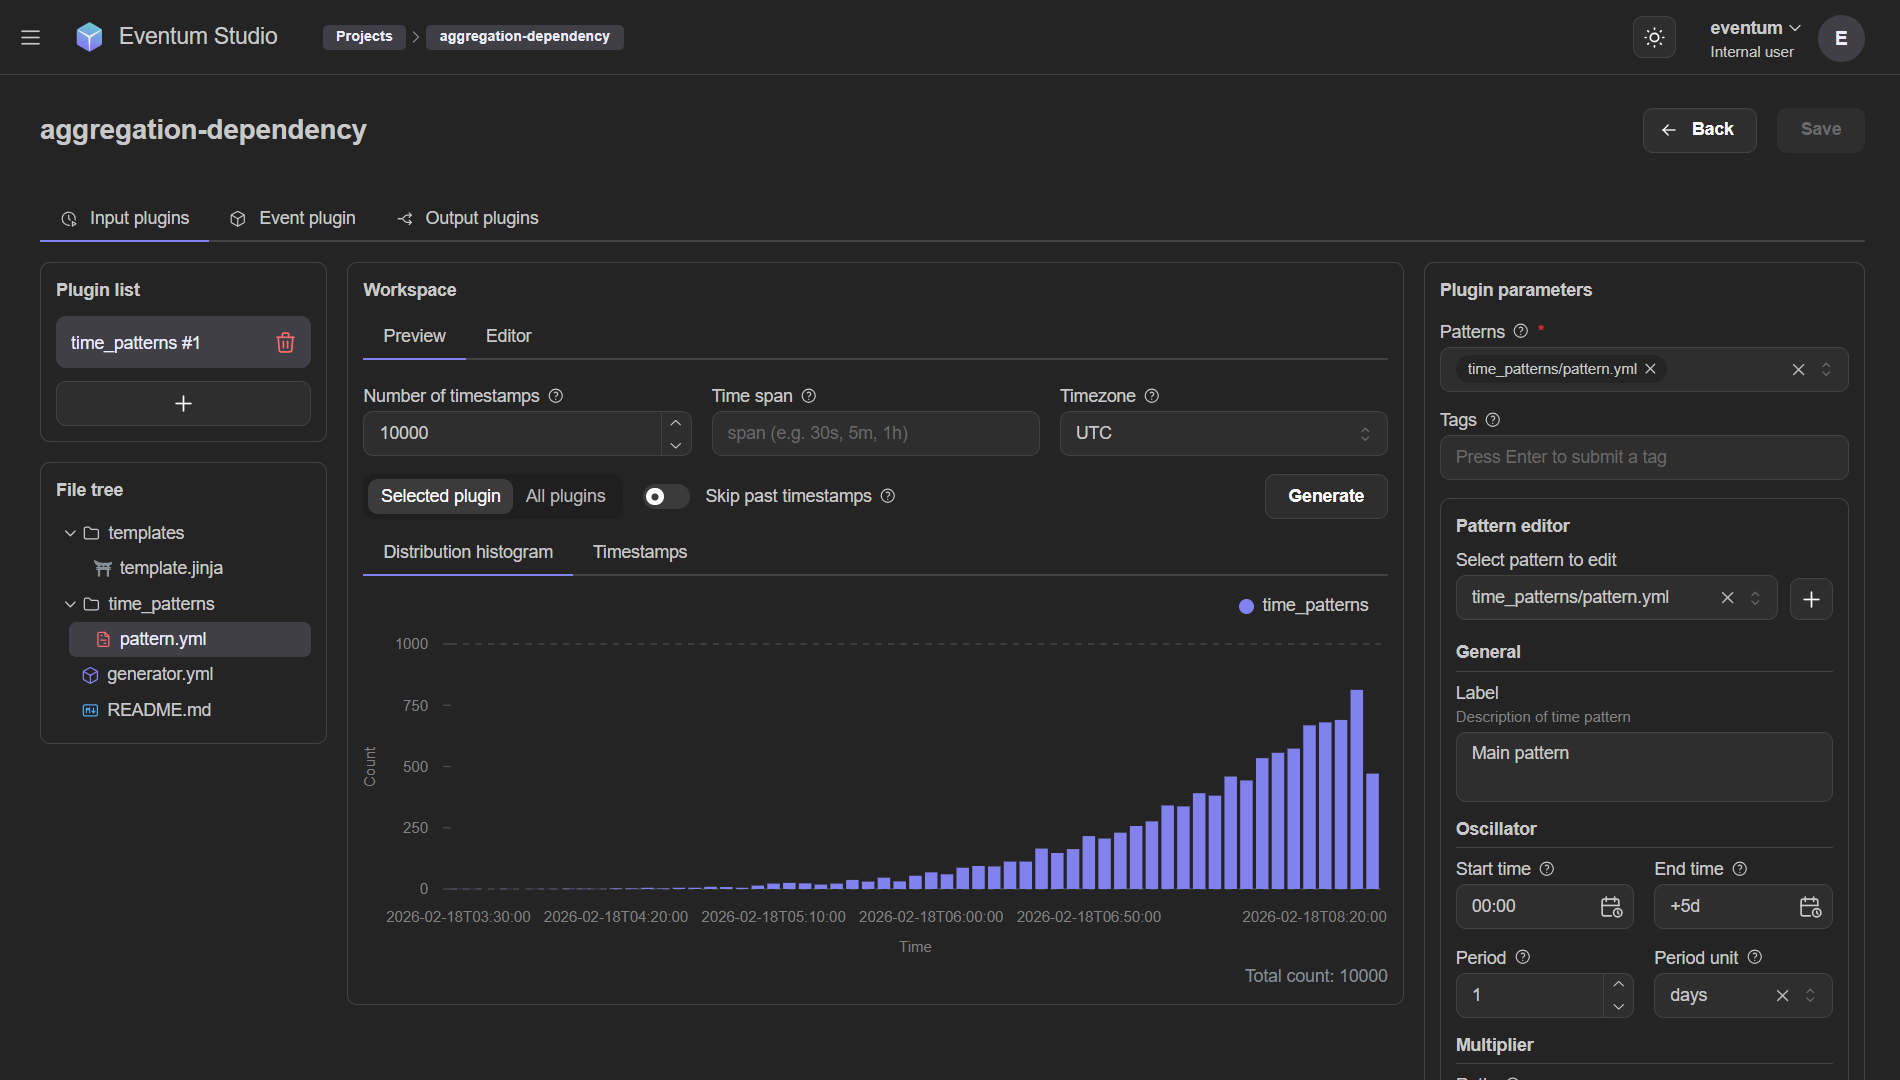
Plugin list
The left sidebar shows the configured input plugins (e.g. time_patterns #1). Click a plugin to select it. Use the + button to add a new input plugin.
Plugin parameters
The right sidebar shows all parameters for the selected input plugin. The fields vary by plugin type — for example, a time_patterns plugin shows:
- Patterns — list of pattern files used by this plugin.
- Tags — string labels attached to every timestamp from this plugin.
- Pattern editor — select a pattern to edit, then configure its Oscillator (start time, end time, period, period unit), Multiplier, Randomizer, and Spreader sections in form fields.
For other plugin types (cron, timer, linspace, etc.), the right sidebar shows their respective parameters.
Workspace — Preview
The center area provides a scheduling preview tool:
- Number of timestamps — how many timestamps to generate for the preview (e.g. 10000).
- Time span — bin width of preview histogram (e.g. "30s", "5m", "1h").
- Timezone — timezone for timestamp interpretation.
- Selected plugin / All plugins — toggle between previewing only the selected plugin or merging all input plugins together.
- Skip past timestamps — toggle to exclude timestamps that have already passed.
Click Generate to run the preview. The result is displayed as:
- Distribution histogram — a bar chart showing how timestamps are distributed over time. This is the fastest way to verify that your scheduling produces the expected traffic shape — daily peaks, uniform spacing, spiky bursts, etc.
- Timestamps — a raw list of the generated timestamps.
The histogram also shows the Total count at the bottom right.
Event plugin tab
The Event plugin tab is where you configure and debug the event plugin — the stage that turns timestamps into event strings.
The tab has three workspace sub-tabs: Debugger, State, and Editor.
Debugger
The debugger lets you produce events on demand and inspect the output before running a full generator.
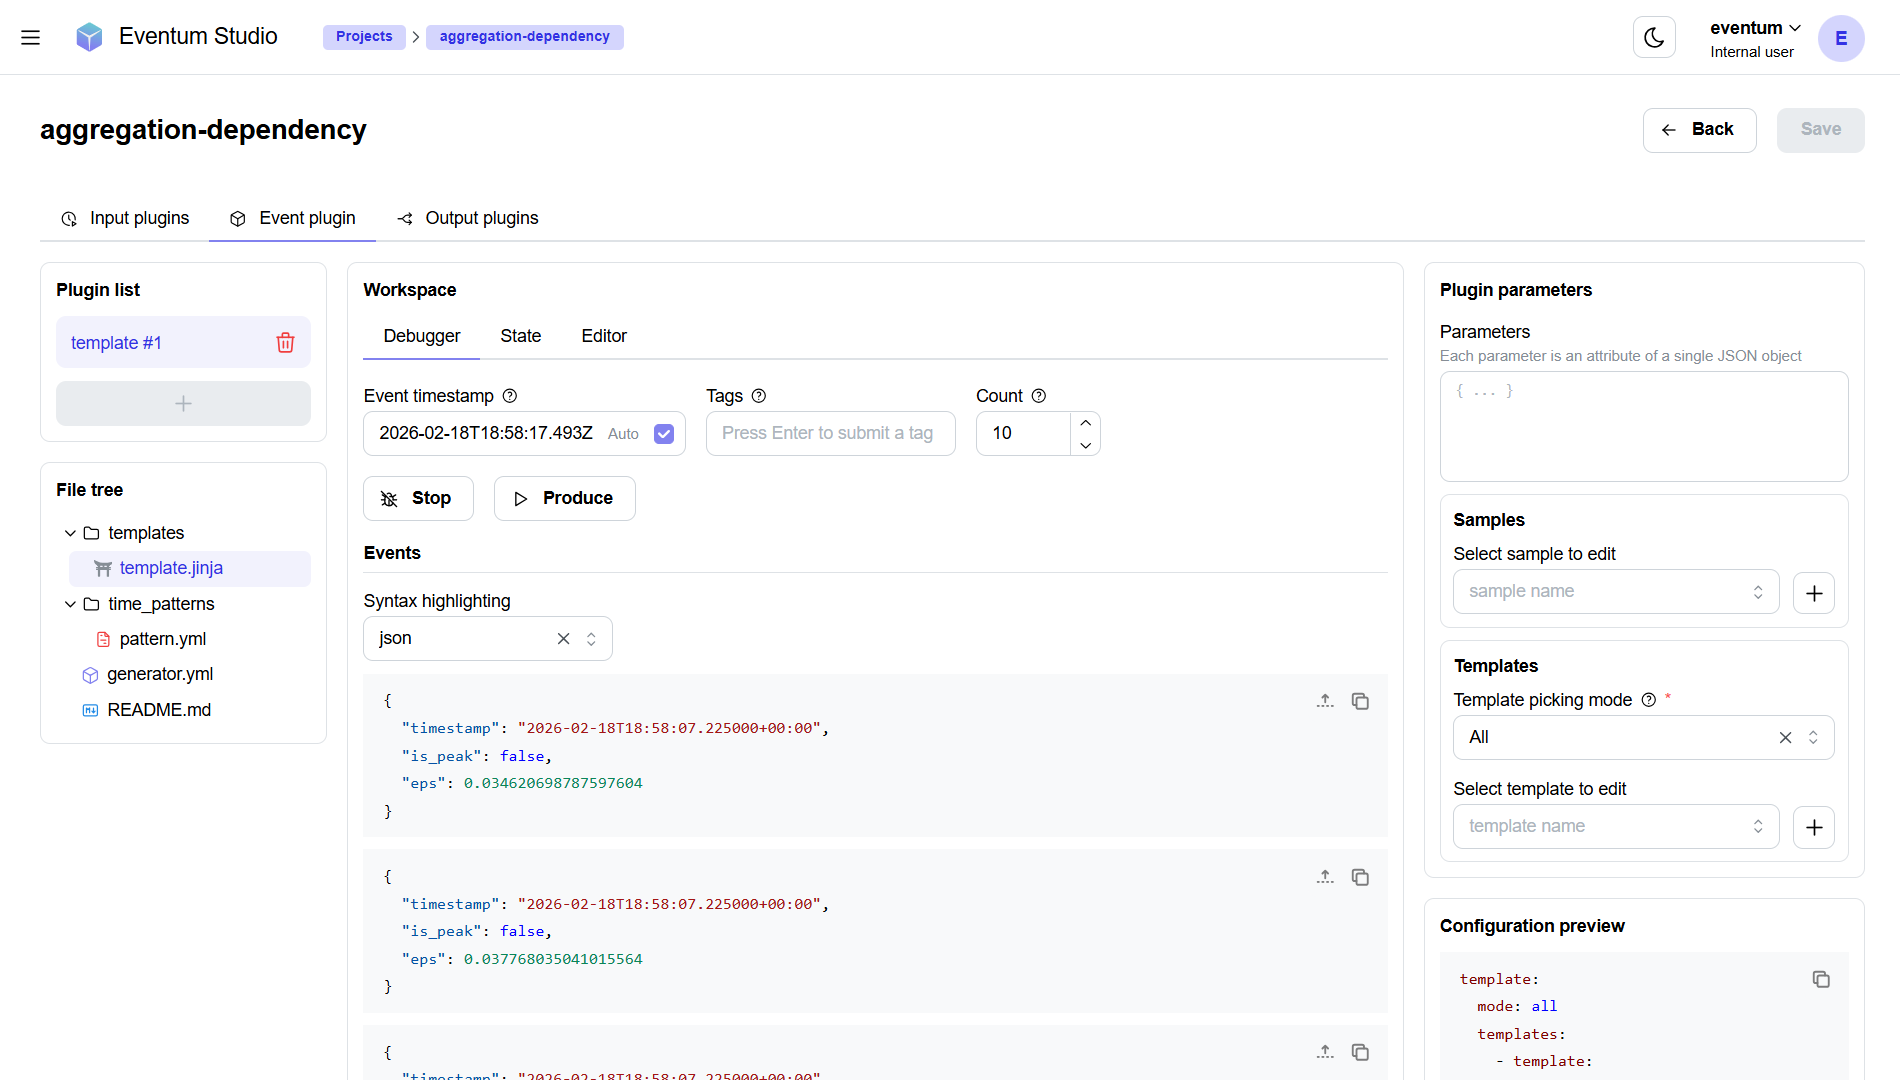
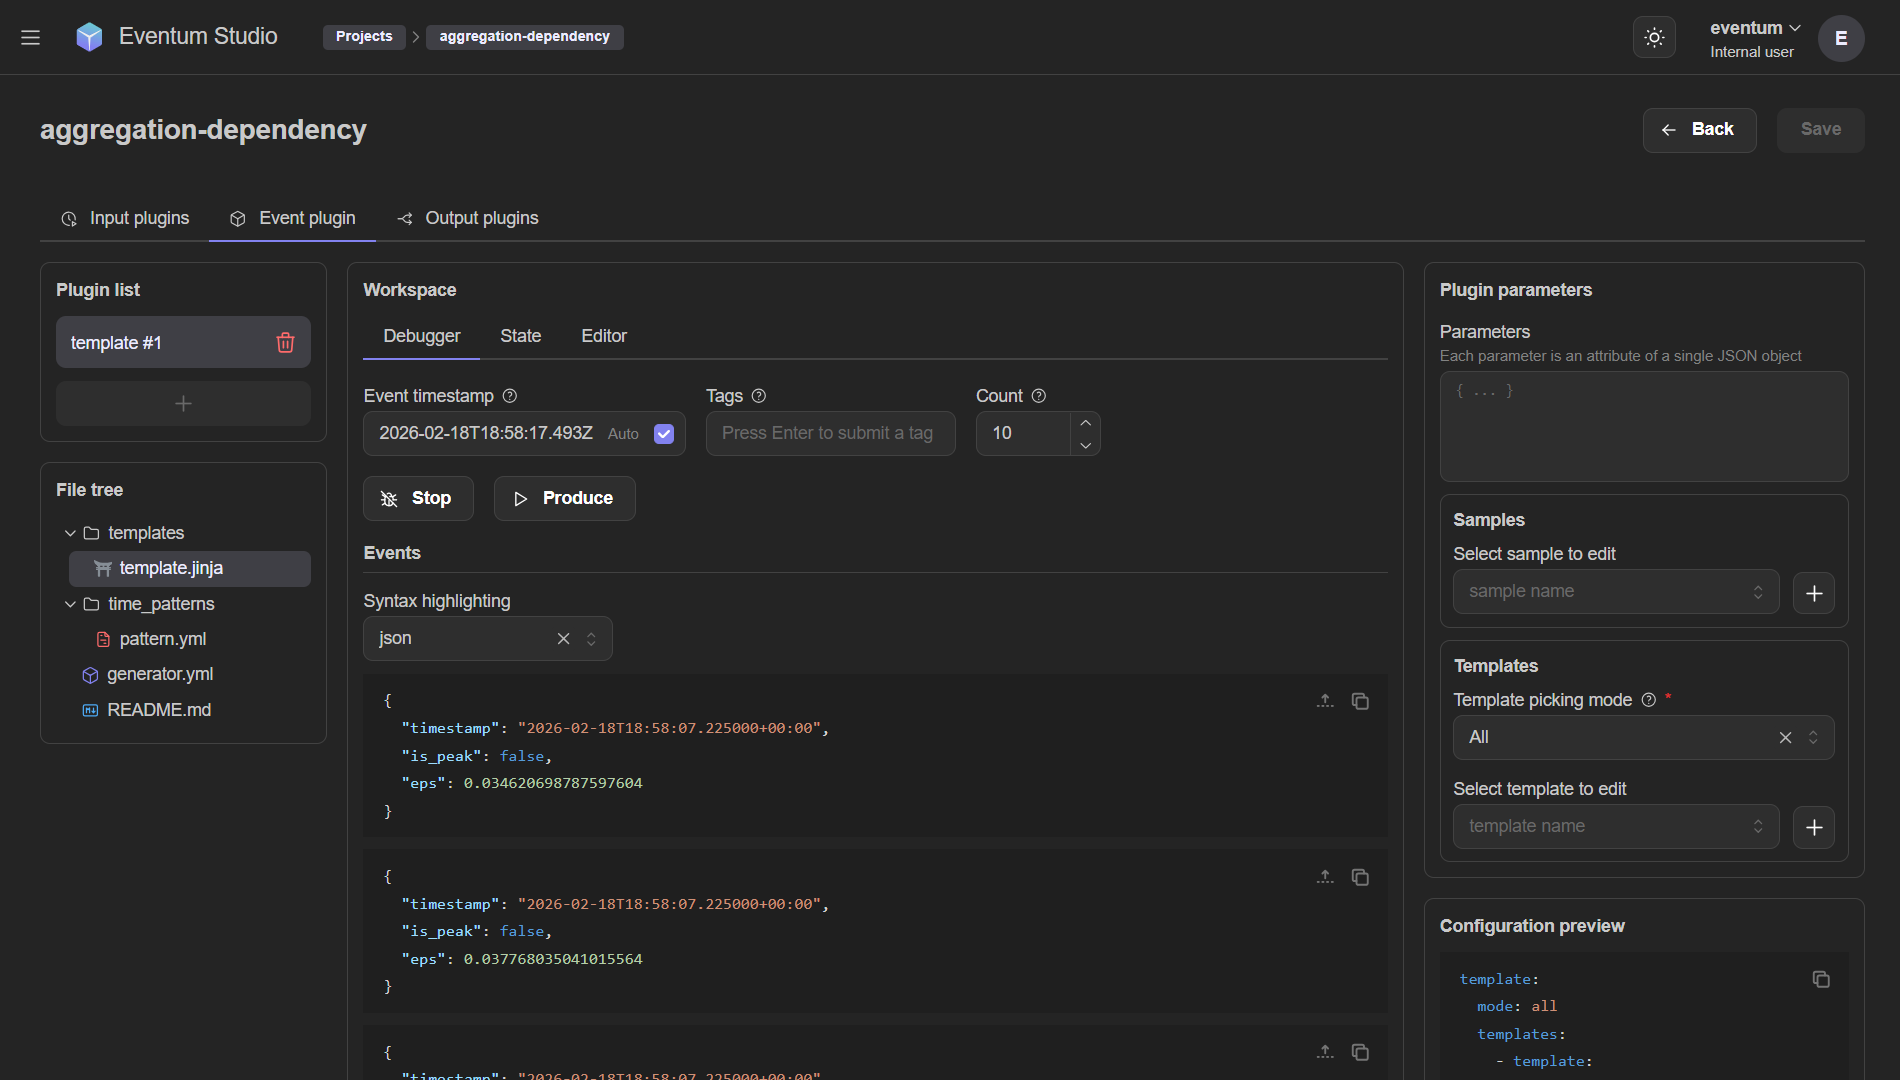
At the top of the debugger workspace:
| Field | Description |
|---|---|
| Event timestamp | The timestamp to pass to the event plugin. Defaults to the current time with an Auto toggle that keeps it up to date. |
| Tags | Optional tags to pass alongside the timestamp (simulates tags from input plugins). |
| Count | How many events to produce in one run (e.g. 10). |
Two action buttons:
- Stop — stop the debugger.
- Produce — trigger event production with the current settings.
Below the controls, the Events section shows the produced output:
- Syntax highlighting — select the format (e.g. "json") for colored output.
- Each event is displayed in its own card with expand/collapse and copy buttons.
This is the fastest way to iterate on templates or scripts — change a template in the editor, re-start the debugger, click Produce, and immediately see the output. No need to start a full generator.
State
The State tab exposes the event plugin's internal state — useful for debugging stateful templates that use locals, shared, or globals.
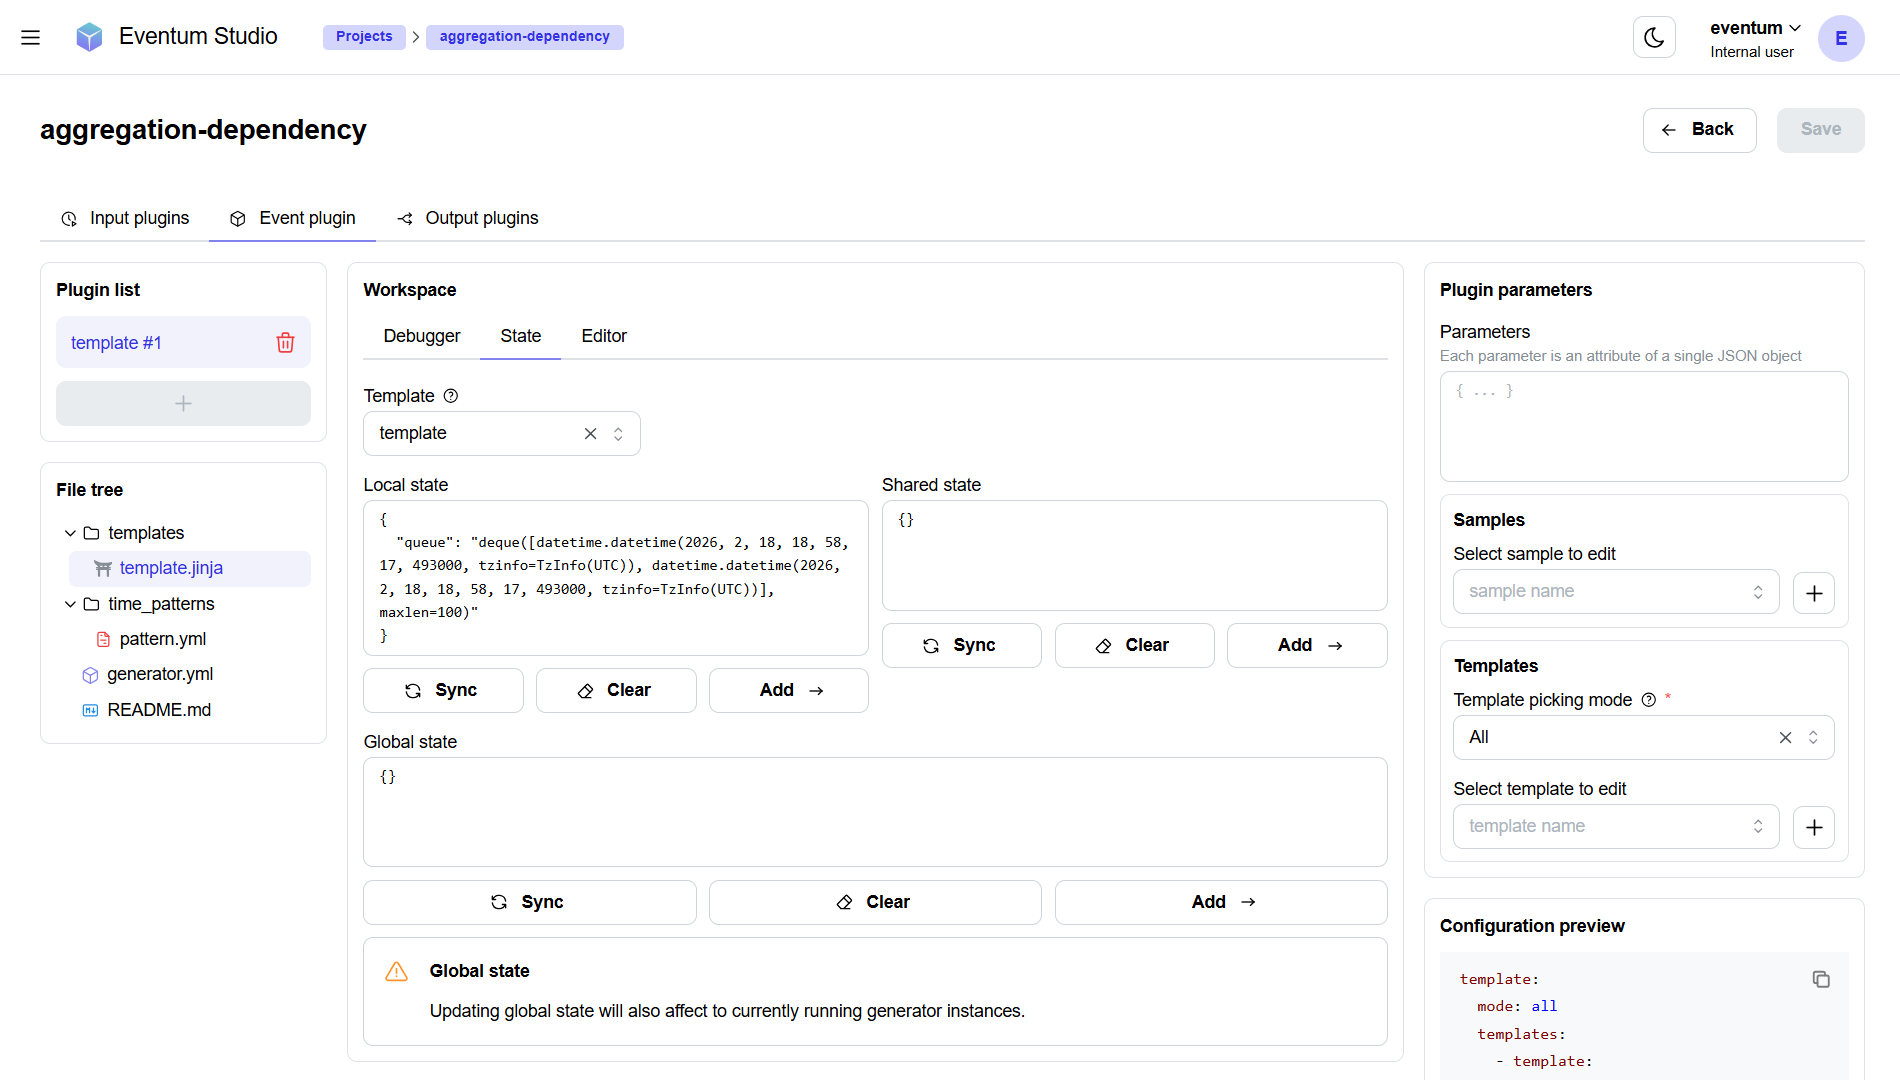
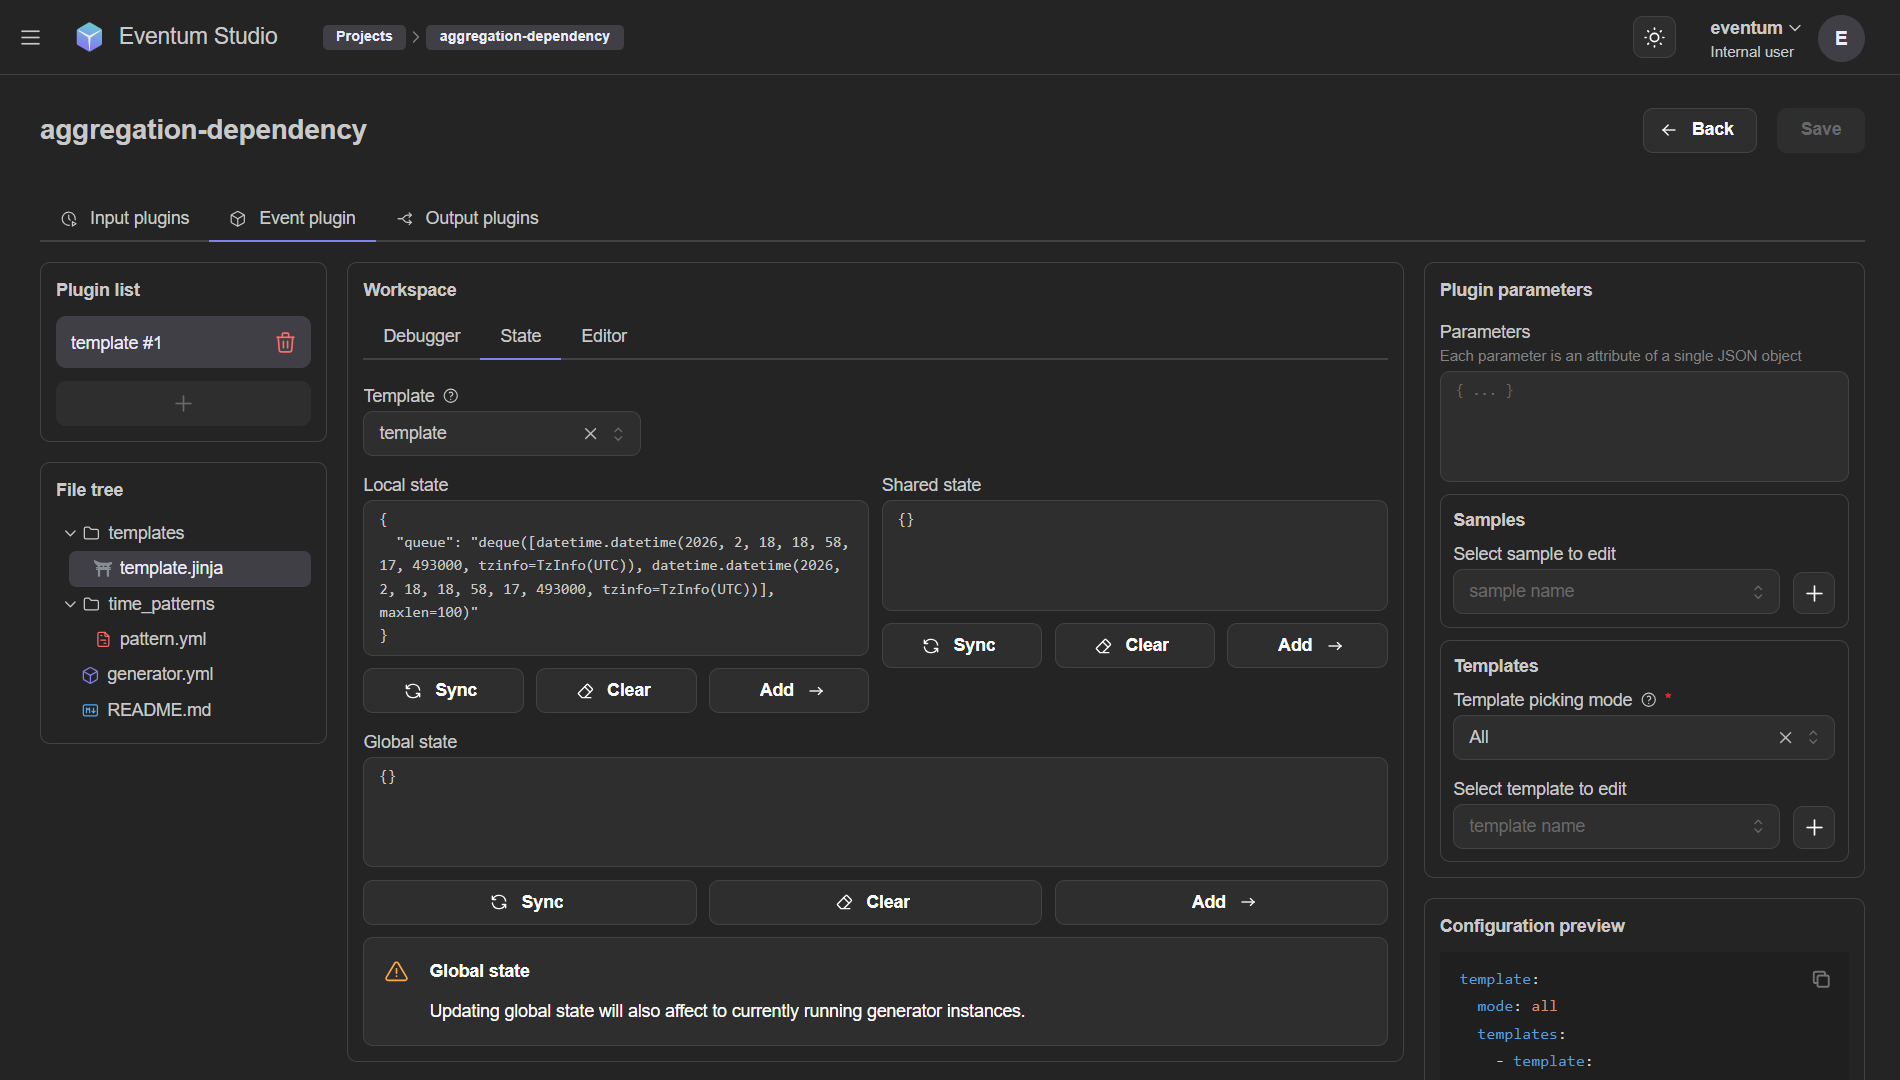
Three state scopes are displayed:
| Scope | Description |
|---|---|
| Local state | State specific to the selected template. Each template has its own locals dictionary. |
| Shared state | State shared across all templates in this generator. Accessible as shared in templates. |
| Global state | State shared across all generators in the application. Accessible as globals in templates. |
Each scope shows the current state as a JSON object and provides three buttons:
- Sync — refresh the state from the backend (useful when a running instance has modified it).
- Clear — reset the state to an empty object.
- Add — add specified keys-values to state.
Modifying Global state from the State tab affects all currently running generator instances, not just the one you're editing. Use with caution.
Editor
The Editor tab provides a code editor with syntax highlighting for the template, script or any other file.
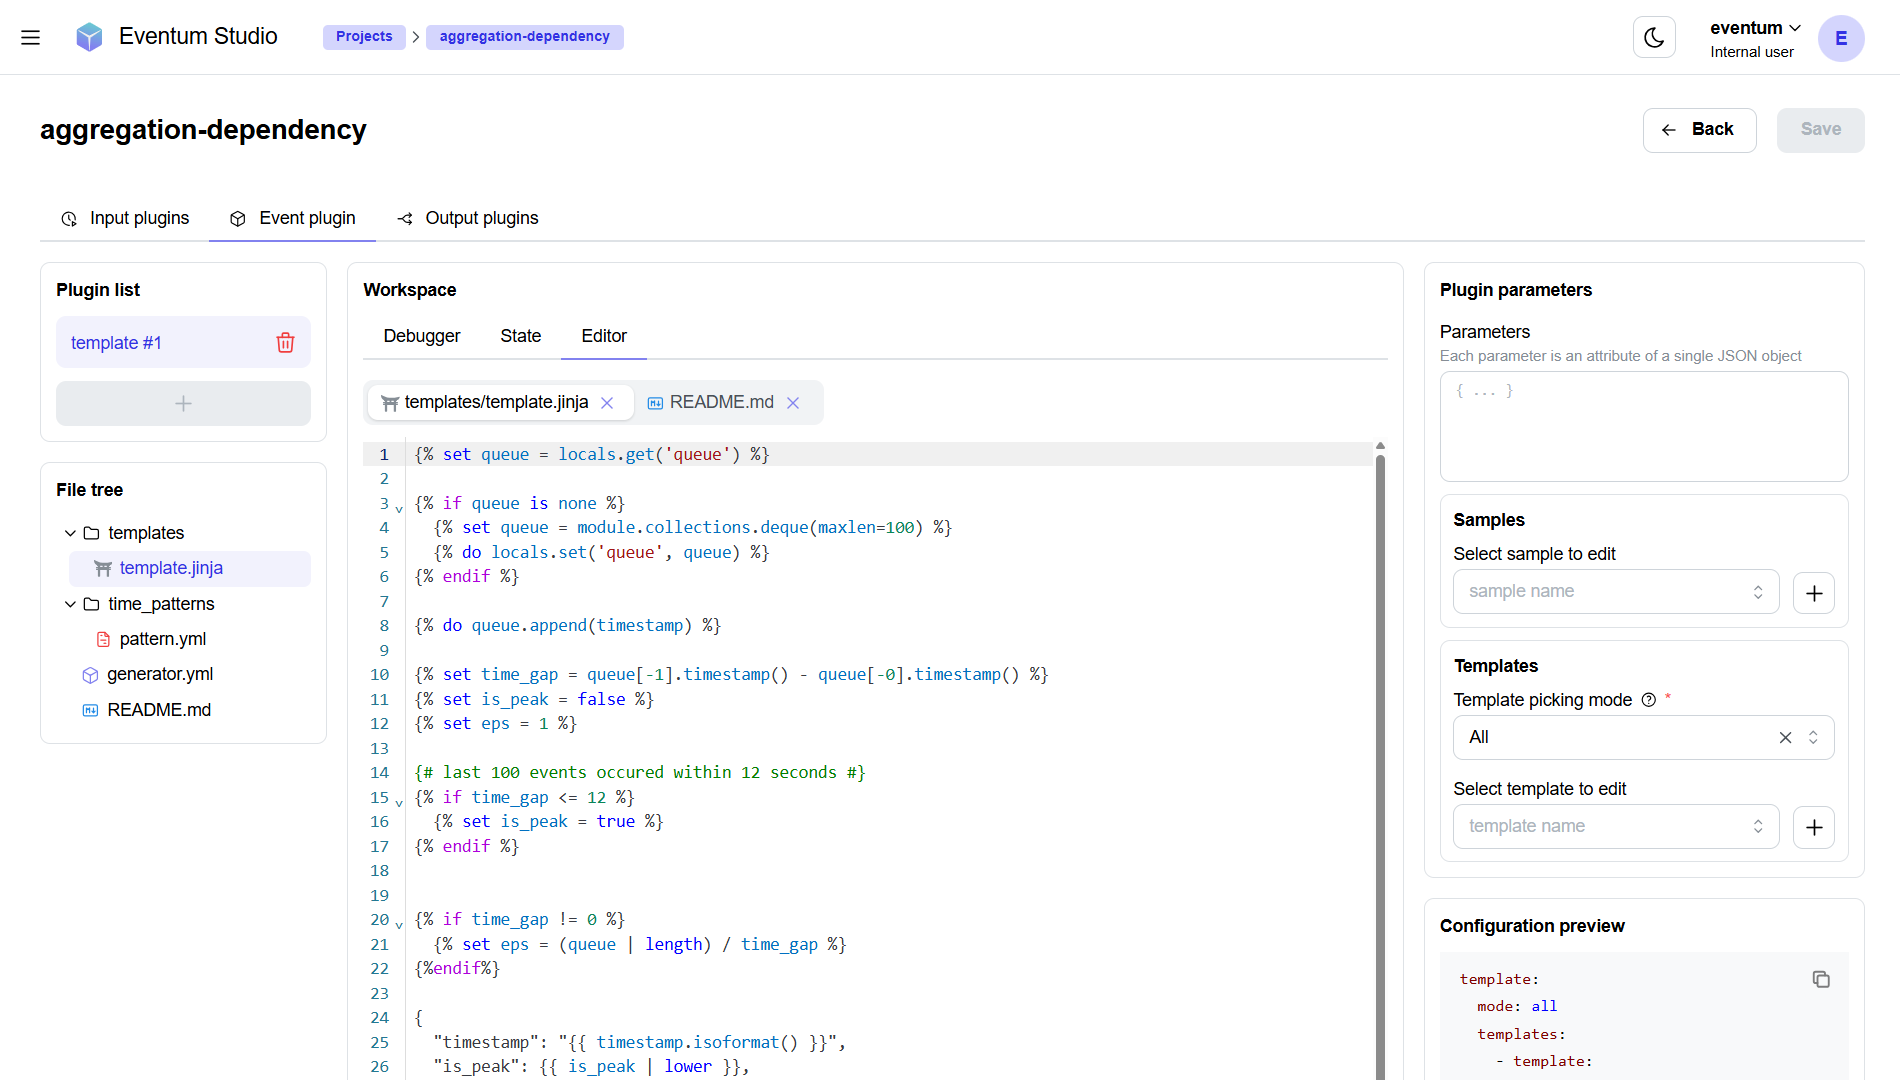
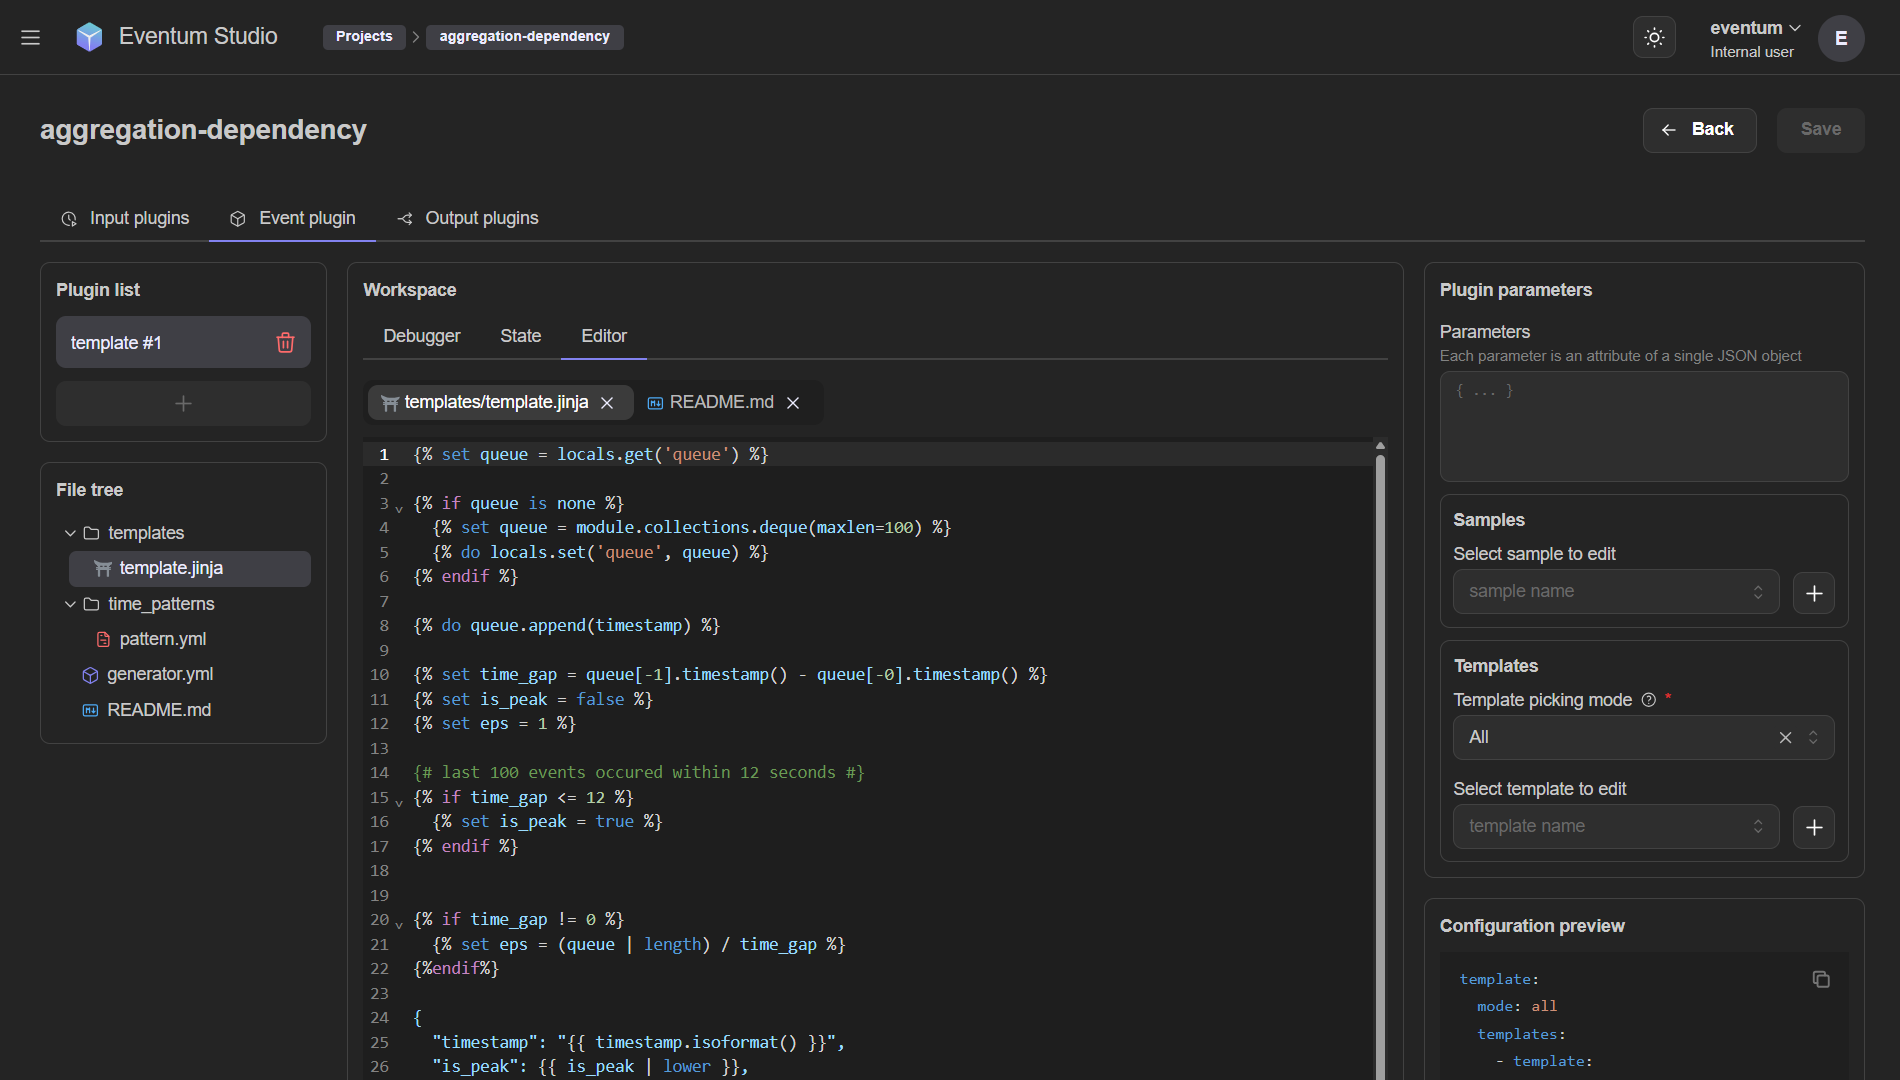
Editor features:
- Tab bar — open files as tabs (e.g.
templates/template.jinja,README.md). Multiple files can be open simultaneously. - Syntax highlighting — Jinja, Python, YAML, JSON, Markdown and other formats are highlighted.
- Autocomplete — basic intellisense is implemented for Jinja templates and Python scripts.
Changes are saved to disk when you press Ctrl + S.
Output plugins tab
The Output plugins tab lets you configure output plugins and test their formatters.
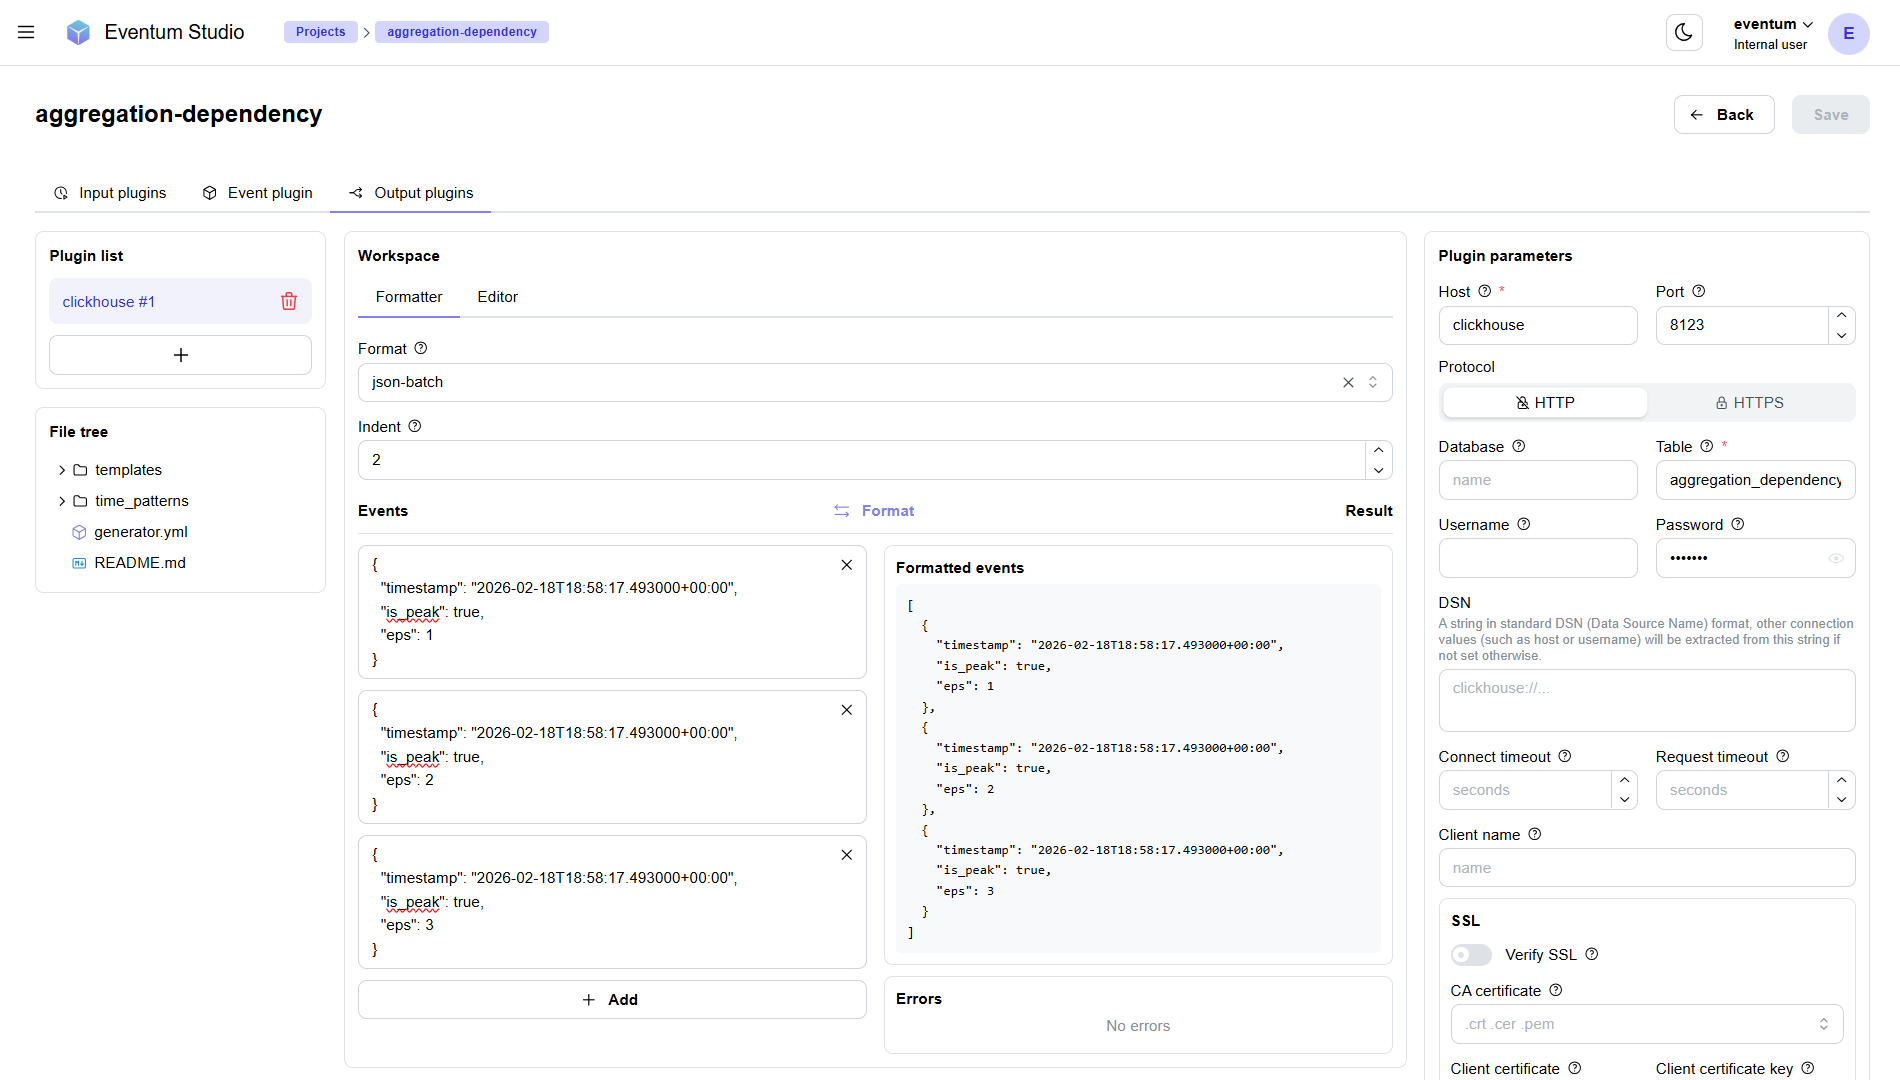
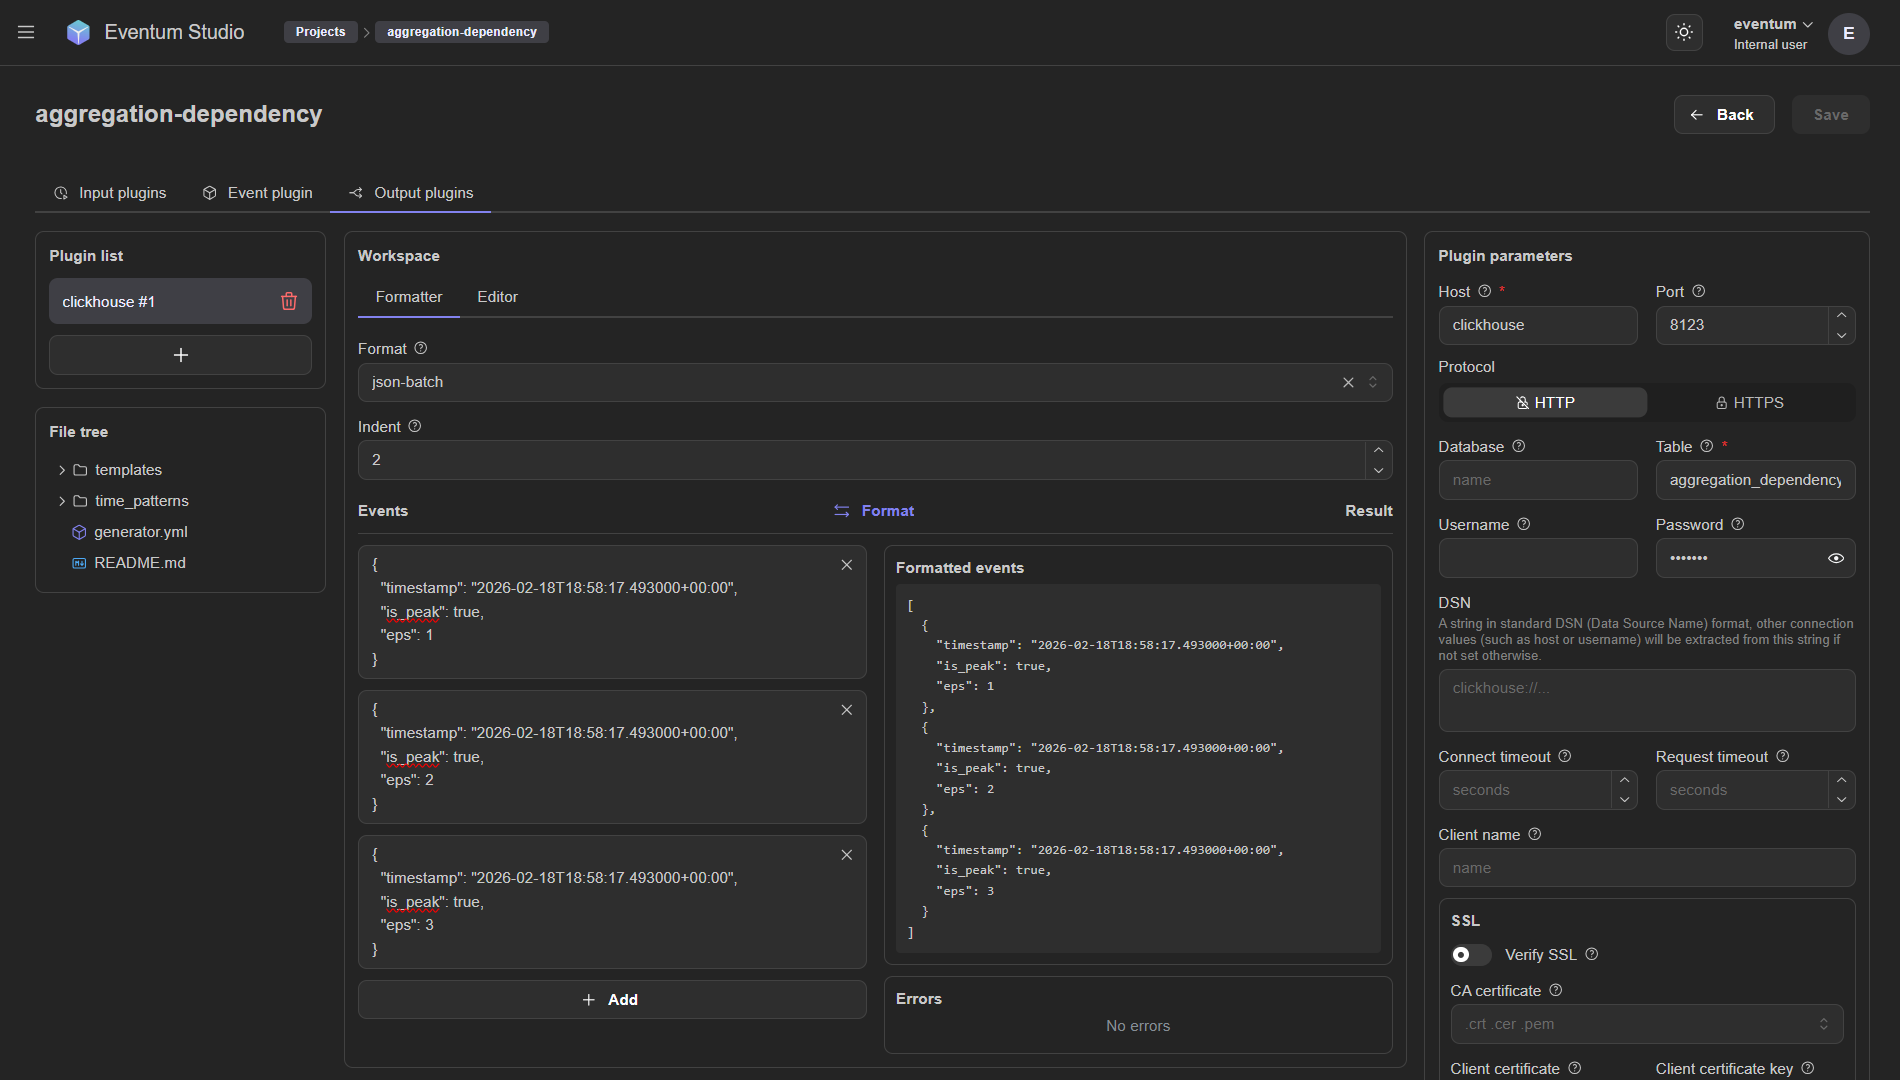
Workspace — Formatter
The center workspace provides a live formatter testing tool. The Formatter sub-tab shows:
- Format — dropdown to select the formatter type (e.g.
json-batch,plain,json,template,template-batch). - Indent, ... — parameters of the selected formatter.
Below the formatter settings, a two-column view lets you test formatting interactively:
- Events (left) — add sample events as text input. Each event is an editable card.
- Formatted events (right, under Result) — click Format to apply the formatter and see the transformed output.
- Errors — any formatting errors are displayed below the result.
This is a useful way to verify that your events are valid for the chosen formatter before running a full pipeline — especially for JSON formatters that will reject invalid JSON.